Decoding Elliott Wave Theory: The Puzzle of Corrective Waves
Most traders obsess over the momentum of a rising market. They chase the explosive move from point A to point B, convinced that identifying the next big bull run is the only path to profit. If you are looking at price charts and feel like you are constantly getting chopped up during sideways movement, the issue might not be your timing. It could be your understanding of correction.
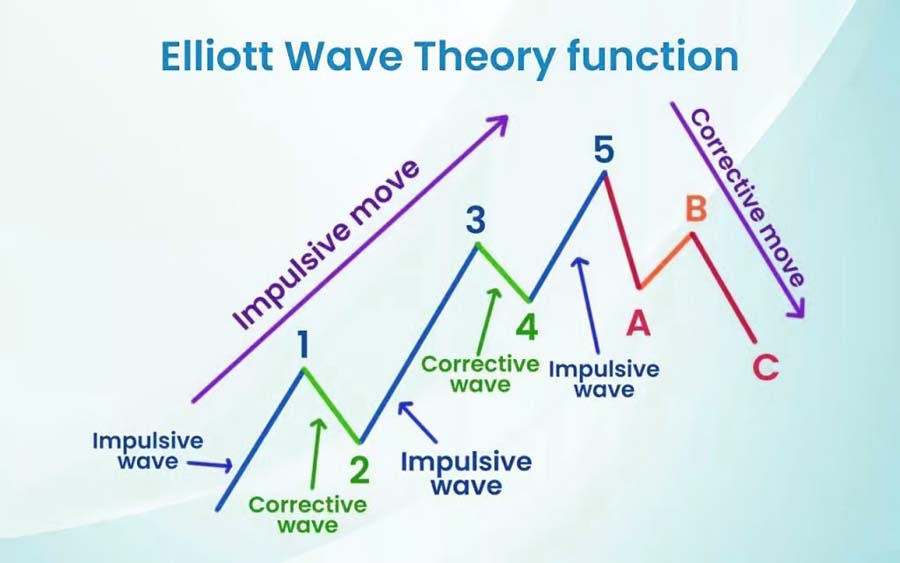
Elliott Wave Theory posits that price action moves in repetitive cycles. While the impulse waves (the five-wave move in the direction of the trend) capture all the headlines, the corrective waves are where most fortunes are lost—and made. Specifically, understanding the three primary corrective patterns—Zigzags, Flat corrections, and Triangles—is essential for anyone serious about technical analysis.
Why Corrections Matter More Than You Think
Let’s get one thing straight: markets do not move in straight lines. They move in waves. Ralph Nelson Elliott, the father of this theory, observed that human psychology drives markets, and that psychology is repetitive. When a trend comes to a halt, it doesn't just pause. It reverses briefly to consolidate supply and demand.
Traders who only focus on impulse waves often enter positions right before a major pullback. They panic sell at the bottom of the correction, missing the subsequent rally. By learning to identify the specific structure of these three corrective waves, you can distinguish between a healthy pause and a trend reversal. This distinction is the difference between holding through volatility and getting shaken out.
The Three Primary Corrective Patterns
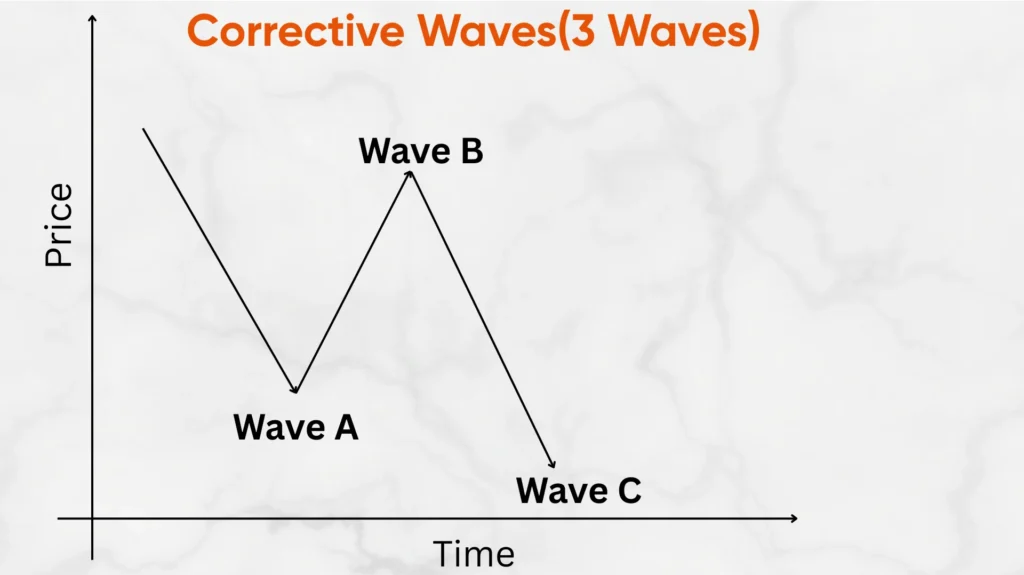
Corrective waves are labeled as waves A, B, and C. Unlike impulse waves, which follow strict rules, corrections are flexible and often messy. However, they generally fall into three archetypes. Recognizing which one is playing out helps you determine where support lies.
1. The Zigzag (The Strong Retracement)
The Zigzag is the most straightforward corrective pattern, often resembling a steep slide down a mountain. It typically occurs when the prevailing trend is strong, meaning the market wants to correct quickly to resume the trend. Structurally, it looks like a 5-3-5 wave pattern:
- Wave A: A five-wave impulse against the main trend.
- Wave B: A three-wave pullback (usually retracing less than 100% of Wave A).
- Wave C: A five-wave impulse that continues in the direction of Wave A, often extending beyond its low.
If you see parallel lines connecting the ends of Wave A and Wave C, you are likely looking at a Zigzag. These corrections can be deep and fast, often catching inexperienced traders off guard because they look like trend reversals.
2. The Flat Correction (The Sideways Pause)
Flat corrections are deceptive. They suggest strength in the prevailing trend because Wave B often rallies to or above the start of Wave A. There are three types: Regular, Irregular, and Running. The Regular Flat is the most common, following a 3-3-5 structure.
In a Regular Flat, Wave A corrects slowly, Wave B bounces back to the starting point, and Wave C drops back to match the low of Wave A. The key here is that the price usually stays within a horizontal channel. Traders often mistake this strength for a new uptrend during Wave B, only to get caught in the leg drop of Wave C. Patience is critical here because the market is essentially stalling, not trending.
3. The Triangle (The Complex Consolidation)
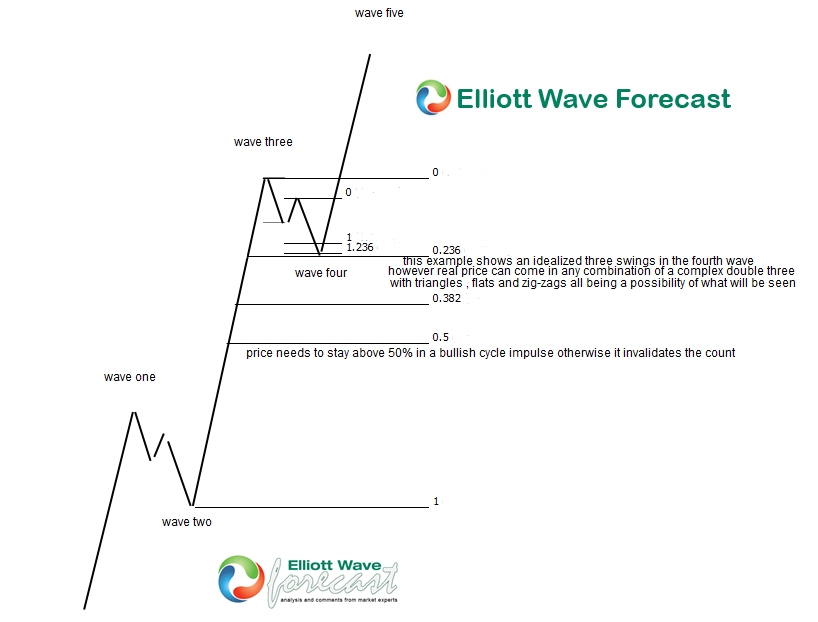
Triangles are unique because they are not composed of simple A-B-C movements. They are complex corrections, often found leading into strong impulse trends, particularly in Wave 4 corrections. An Elliott Triangle consists of five sub-waves, typically labeled A-B-C-D-E.
As the price moves through these waves, the highs get lower and the lows get higher (in a Contracting Triangle), creating a narrowing range. This represents a period of indecision where supply and demand are balancing out. The breakout usually happens after the fifth wave (Wave E) completes, often with significant volatility. Traders who understand triangles can wait for the breakout rather than getting stuck inside the range.
Practical Application for Traders
Knowing the theory is one thing; applying it is another. When you spot a potential correction, ask yourself: Is the market moving aggressively against the trend (Zigzag), or is it grinding sideways (Flat/Triangle)?
Use Fibonacci retracement levels alongside wave counts. In a Zigzag, Wave B often retraces 50% to 61.8% of Wave A. In a Flat, Wave C often ends near the 100% retracement of Wave A. Combining wave structure with these mathematical levels provides a higher probability setup.
Always keep a backup count. Elliott Waves are subjective. If your primary count fails, have an alternative scenario ready. For example, if you expect a Zigzag but the market forms a higher low after Wave A, reconsider if it might be a Flat correction instead.
Frequently Asked Questions
Can corrective waves last indefinitely?
Theoretically, yes. Corrections can be complex enough to last as long as a trending market. This is why many traders find it difficult to distinguish between a long correction and a new trend reversal. Always use time frames and risk management to protect capital.
Are Elliott Waves useful for crypto trading?Yes, but with caution. Crypto markets are more volatile and driven by sentiment and news than traditional equities. While the psychological patterns hold, the waves can be erratic and extend further than classical theory suggests. Fib extensions are often more relevant than retracements in crypto.
Which correction pattern is most common?Flat corrections and Zigzags tend to appear most frequently in standard equity and forex markets. Triangles are less common but often precede the strongest move in the market, making them highly valuable to identify when they do occur.
:max_bytes(150000):strip_icc()/elliott-wave-tricks-to-improve-trading-4153295_FINAL-3500ecb730a84818b040c75f73a1fa98.png)