Decoding Research Scores: What They Actually Mean
You hear the term research scores thrown around in boardrooms, academic journals, and tech reviews, but nobody seems to agree on what they actually measure. Is it a grade? A ranking? A prediction? The truth is, it’s all of those things, depending entirely on context. Understanding these metrics isn't just about reading a number; it’s about decoding the methodology behind it. If you take the score at face value without understanding the framework, you’re likely making decisions on a shaky foundation.
Let’s strip away the jargon. A research score is essentially a quantified summary of qualitative or quantitative data. It reduces complex human behavior, market trends, or academic validity into a single, digestible metric. But that compression process is where the magic—and the danger—lies.
The Weighting Problem
The biggest misconception about any score is that it is objective. It is not. Every score is a product of how much weight the creator assigns to specific variables. Imagine you’re rating a smartphone. If the researchers prioritize camera quality heavily, the phone gets a high score. If you care primarily about battery life, that same phone might score poorly.
This is the weighting problem. Without knowing the criteria map, the final number is meaningless. When you see a study claiming a "9/10 effectiveness score," your first question shouldn’t be "Is it actually nine?" It should be, "What did they measure to get nine?"
- Survey-Based Scores: These rely on self-reported data. Think of Amazon reviews or Net Promoter Scores. They are volatile and heavily influenced by recent emotional states rather than long-term utility.
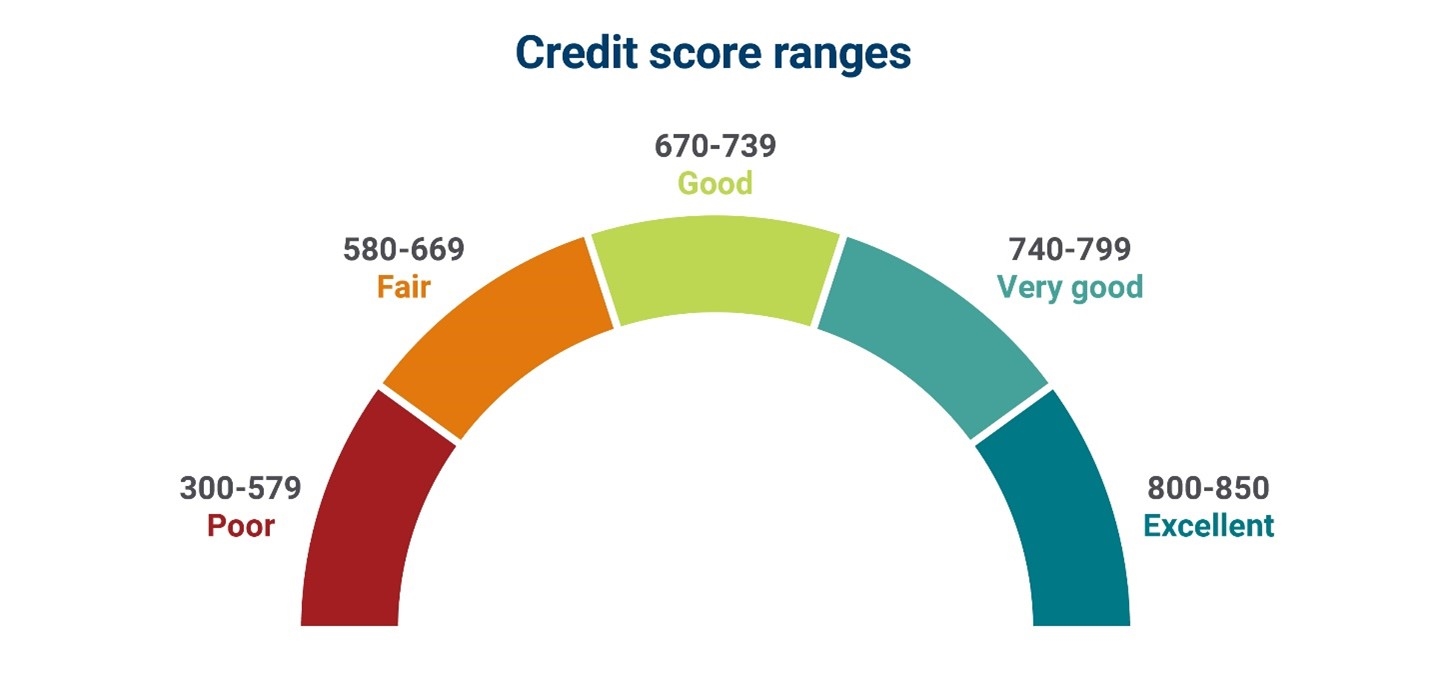
- Algorithmic Scores: Common in SEO and credit ratings. These are updated frequently based on historical data patterns. They are more predictive but often opaque in their calculation methods.
- Peer-Reviewed Metrics: Found in academia. These scores rely on consensus and rigorous methodology. They are slow to change but carry significant authority within their niche.
Recognizing which bucket your score falls into is crucial. An algorithmic score might tell you what will happen in a market, while a survey score tells you how people feel right now. Mixing them up leads to disastrous strategy.
Cultural and Contextual Bias
Data does not exist in a vacuum. Research scores are often biased by the cultural lens of the researchers themselves. A study conducted in Silicon Valley will yield different engagement scores than the exact same study conducted in rural India, even if the product is identical. This isn’t just about language barriers; it’s about usability expectations and digital literacy.
Consider the concept of usability scores in UX design. A Western user might rate a minimalist interface as "clean and intuitive." A user from a culture accustomed to information-dense interfaces might rate that same design as "confusing and sparse." If the research team doesn’t account for this cultural variance, the resulting score is skewed. It reflects the testers’ preferences, not universal truth.
This bias extends to academic research as well. Journals in certain countries may prioritize quantitative data over qualitative insights, leading to higher scores for studies that rely on hard numbers rather than nuanced human experiences. If you are citing a research score, you need to know who collected the data and where. Local context matters more than you think.
Statistical Significance vs. Practical Significance
Here is where most people get tripped up. A research score can be statistically significant but completely useless in practice. This is a subtle but critical distinction.
Statistical significance tells you that the result is unlikely to have happened by chance. Practical significance tells you whether the result matters in the real world. Let’s say a new marketing campaign increases conversion rates by 0.01%. That change might be statistically significant if you have a massive sample size. Should you give the campaign a high score? Probably not. The effort to implement it likely outweighs the 0.01% gain.
High scores often mask small margins. When evaluating a research score, always ask: Does this delta impact the bottom line? If the score is 85 out of 100, is that significantly better than an 80? In many academic contexts, yes. In direct-to-consumer marketing, the margin of error might swallow that difference whole. Don’t worship the number; worship the implication of the number.
How to Read Between the Lines
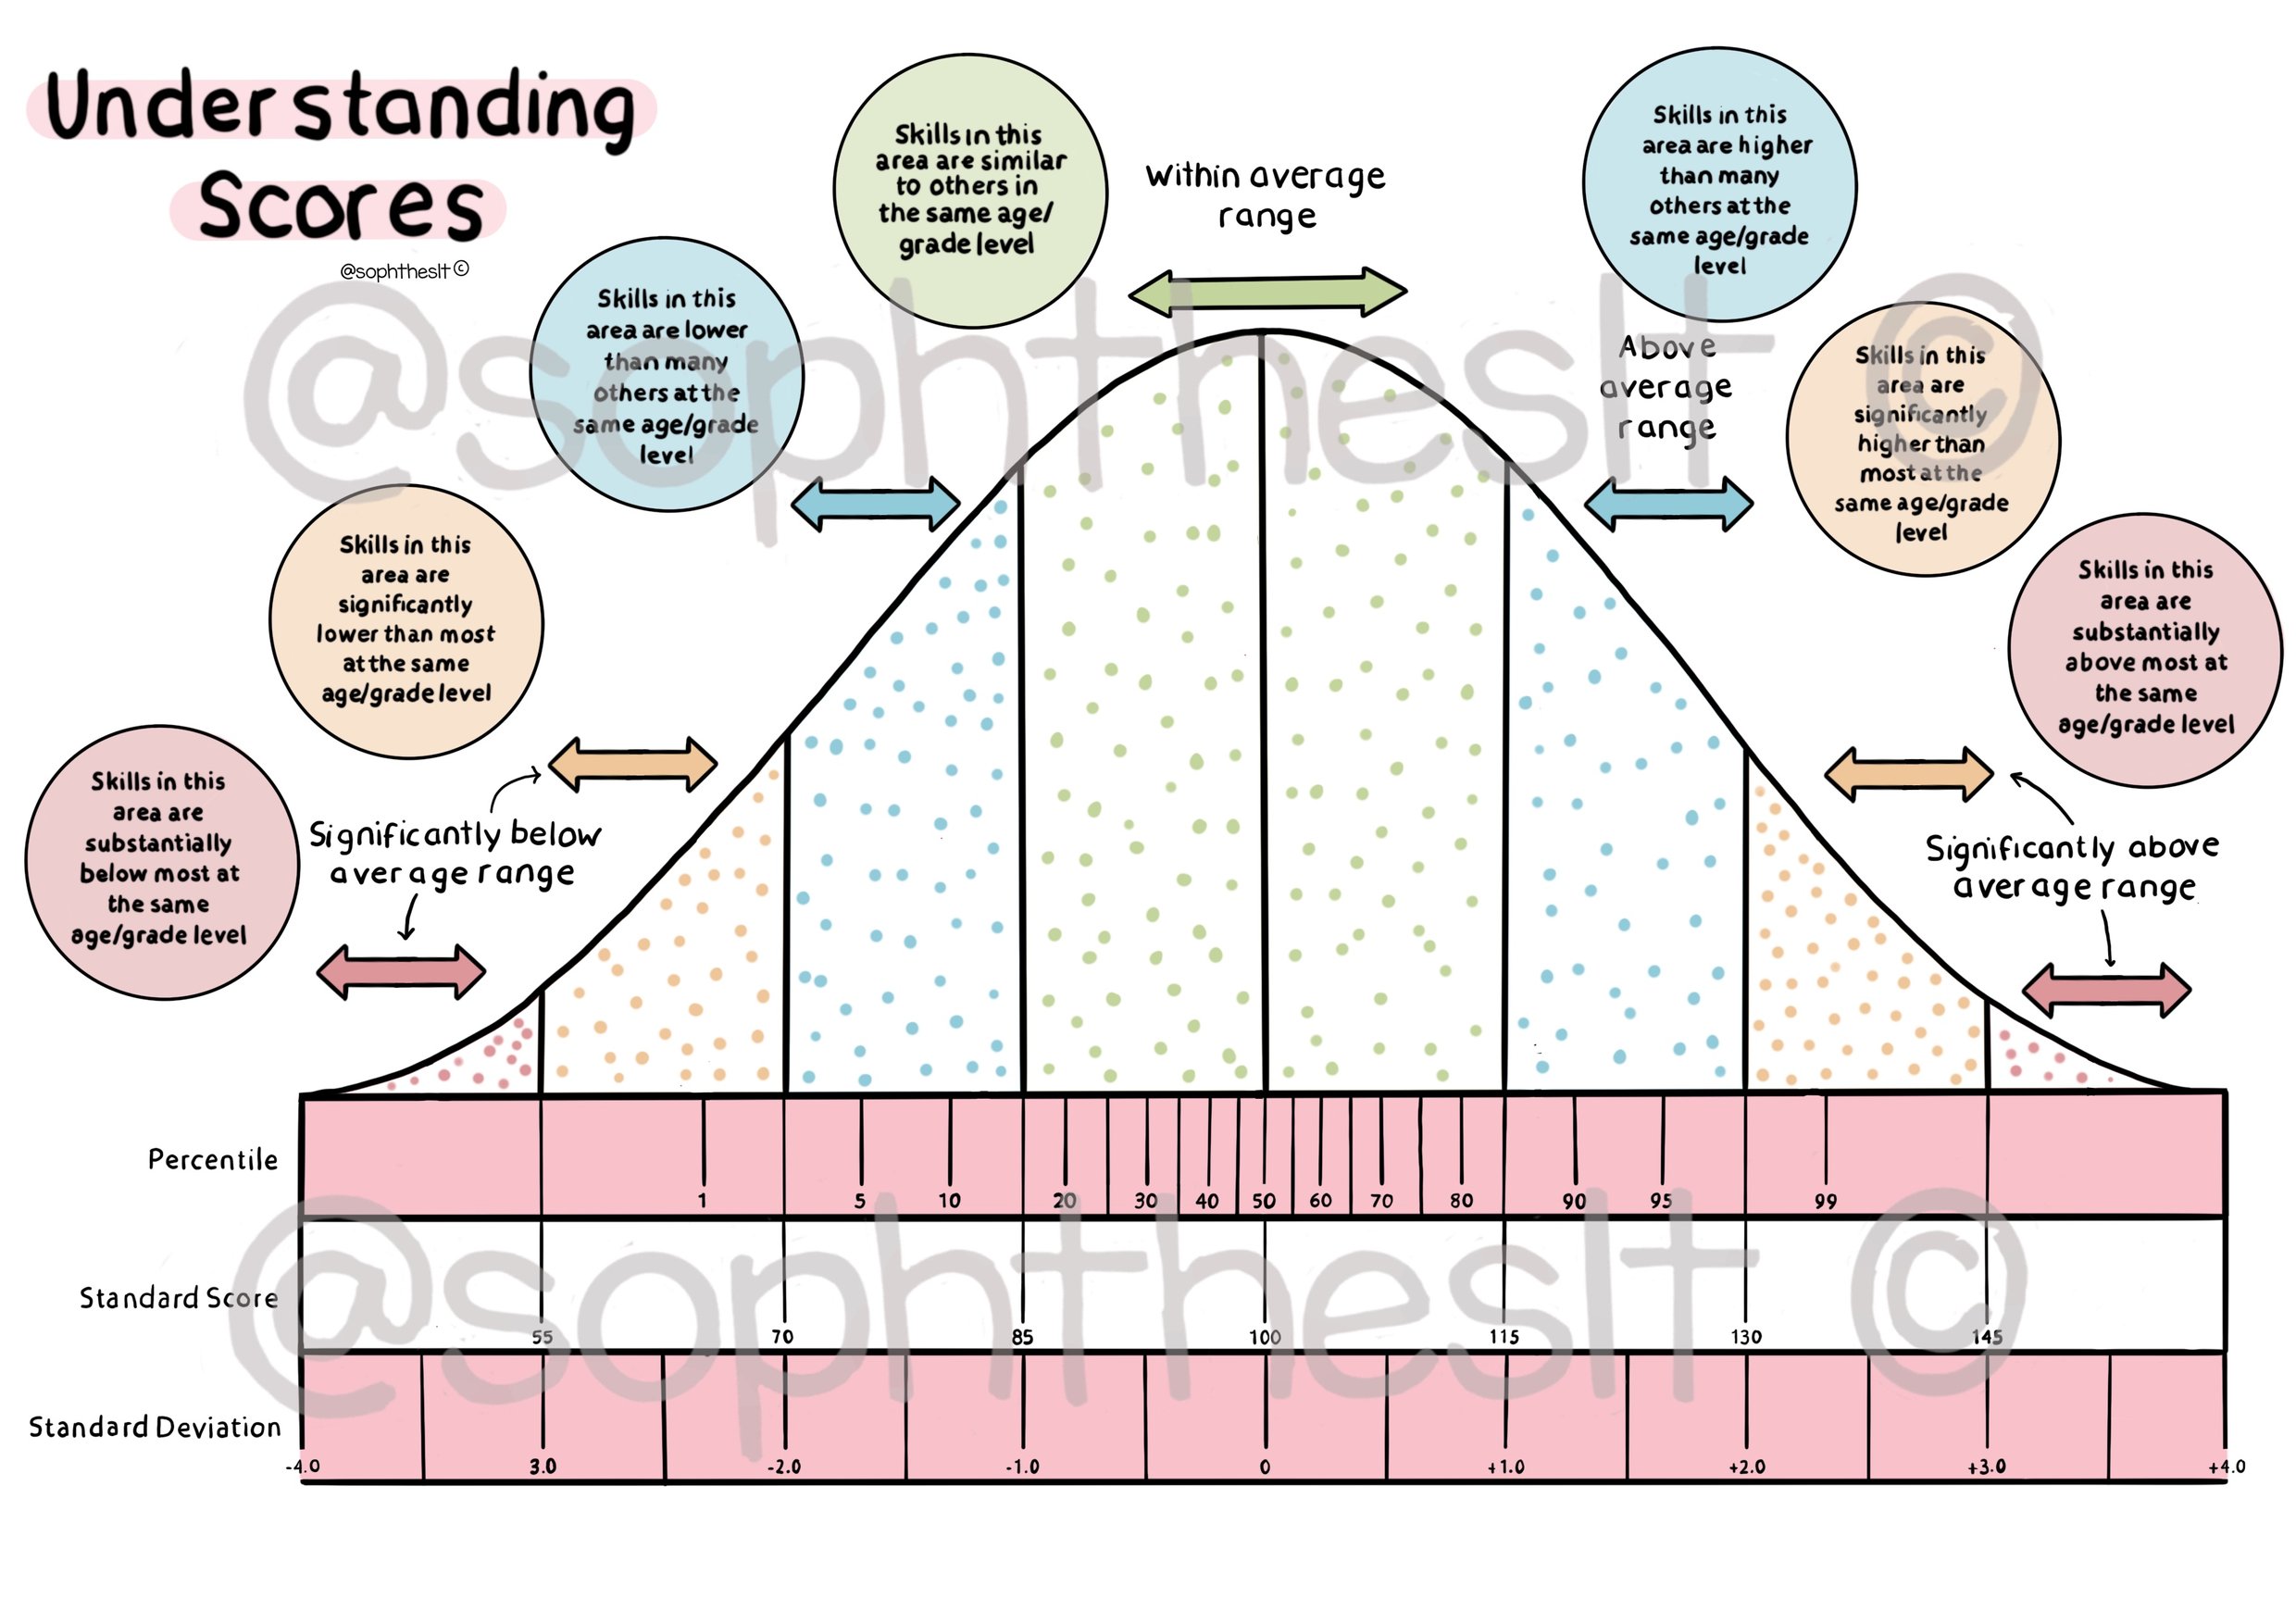
So, how do you use research scores effectively without being misled? Start by looking at the standard deviation. A score of 80 with a wide standard deviation means the data is all over the place. The average is shaky. A score of 75 with a tight standard deviation is a much more reliable indicator of performance.
Second, check the sample size. A score derived from 1,000 participants carries far more weight than one from 50. Small samples are prone to outliers that crash or inflate the final metric. If you’re reading a tech review with a "90% recommendation score," check if they tested ten units or ten thousand. The latter is science; the former is an opinion piece with a calculator.
Finally, look for transparency. Reputable research publishes its methodology. If they hide how they calculated the score, assume there is a reason. Are they omitting a variable that would drag the score down? Are they cherry-picking timeframes where the product performed best? Transparency is the hallmark of a trustworthy score.
The Takeaway
Research scores are tools, not truths. They are simplified representations of complex realities. Use them to identify trends, compare options, and spot outliers, but never let them replace critical thinking. Always dig into the methodology, understand the weighting, and consider the context. When you do, that single number transforms from a vague label into a powerful piece of intelligence.