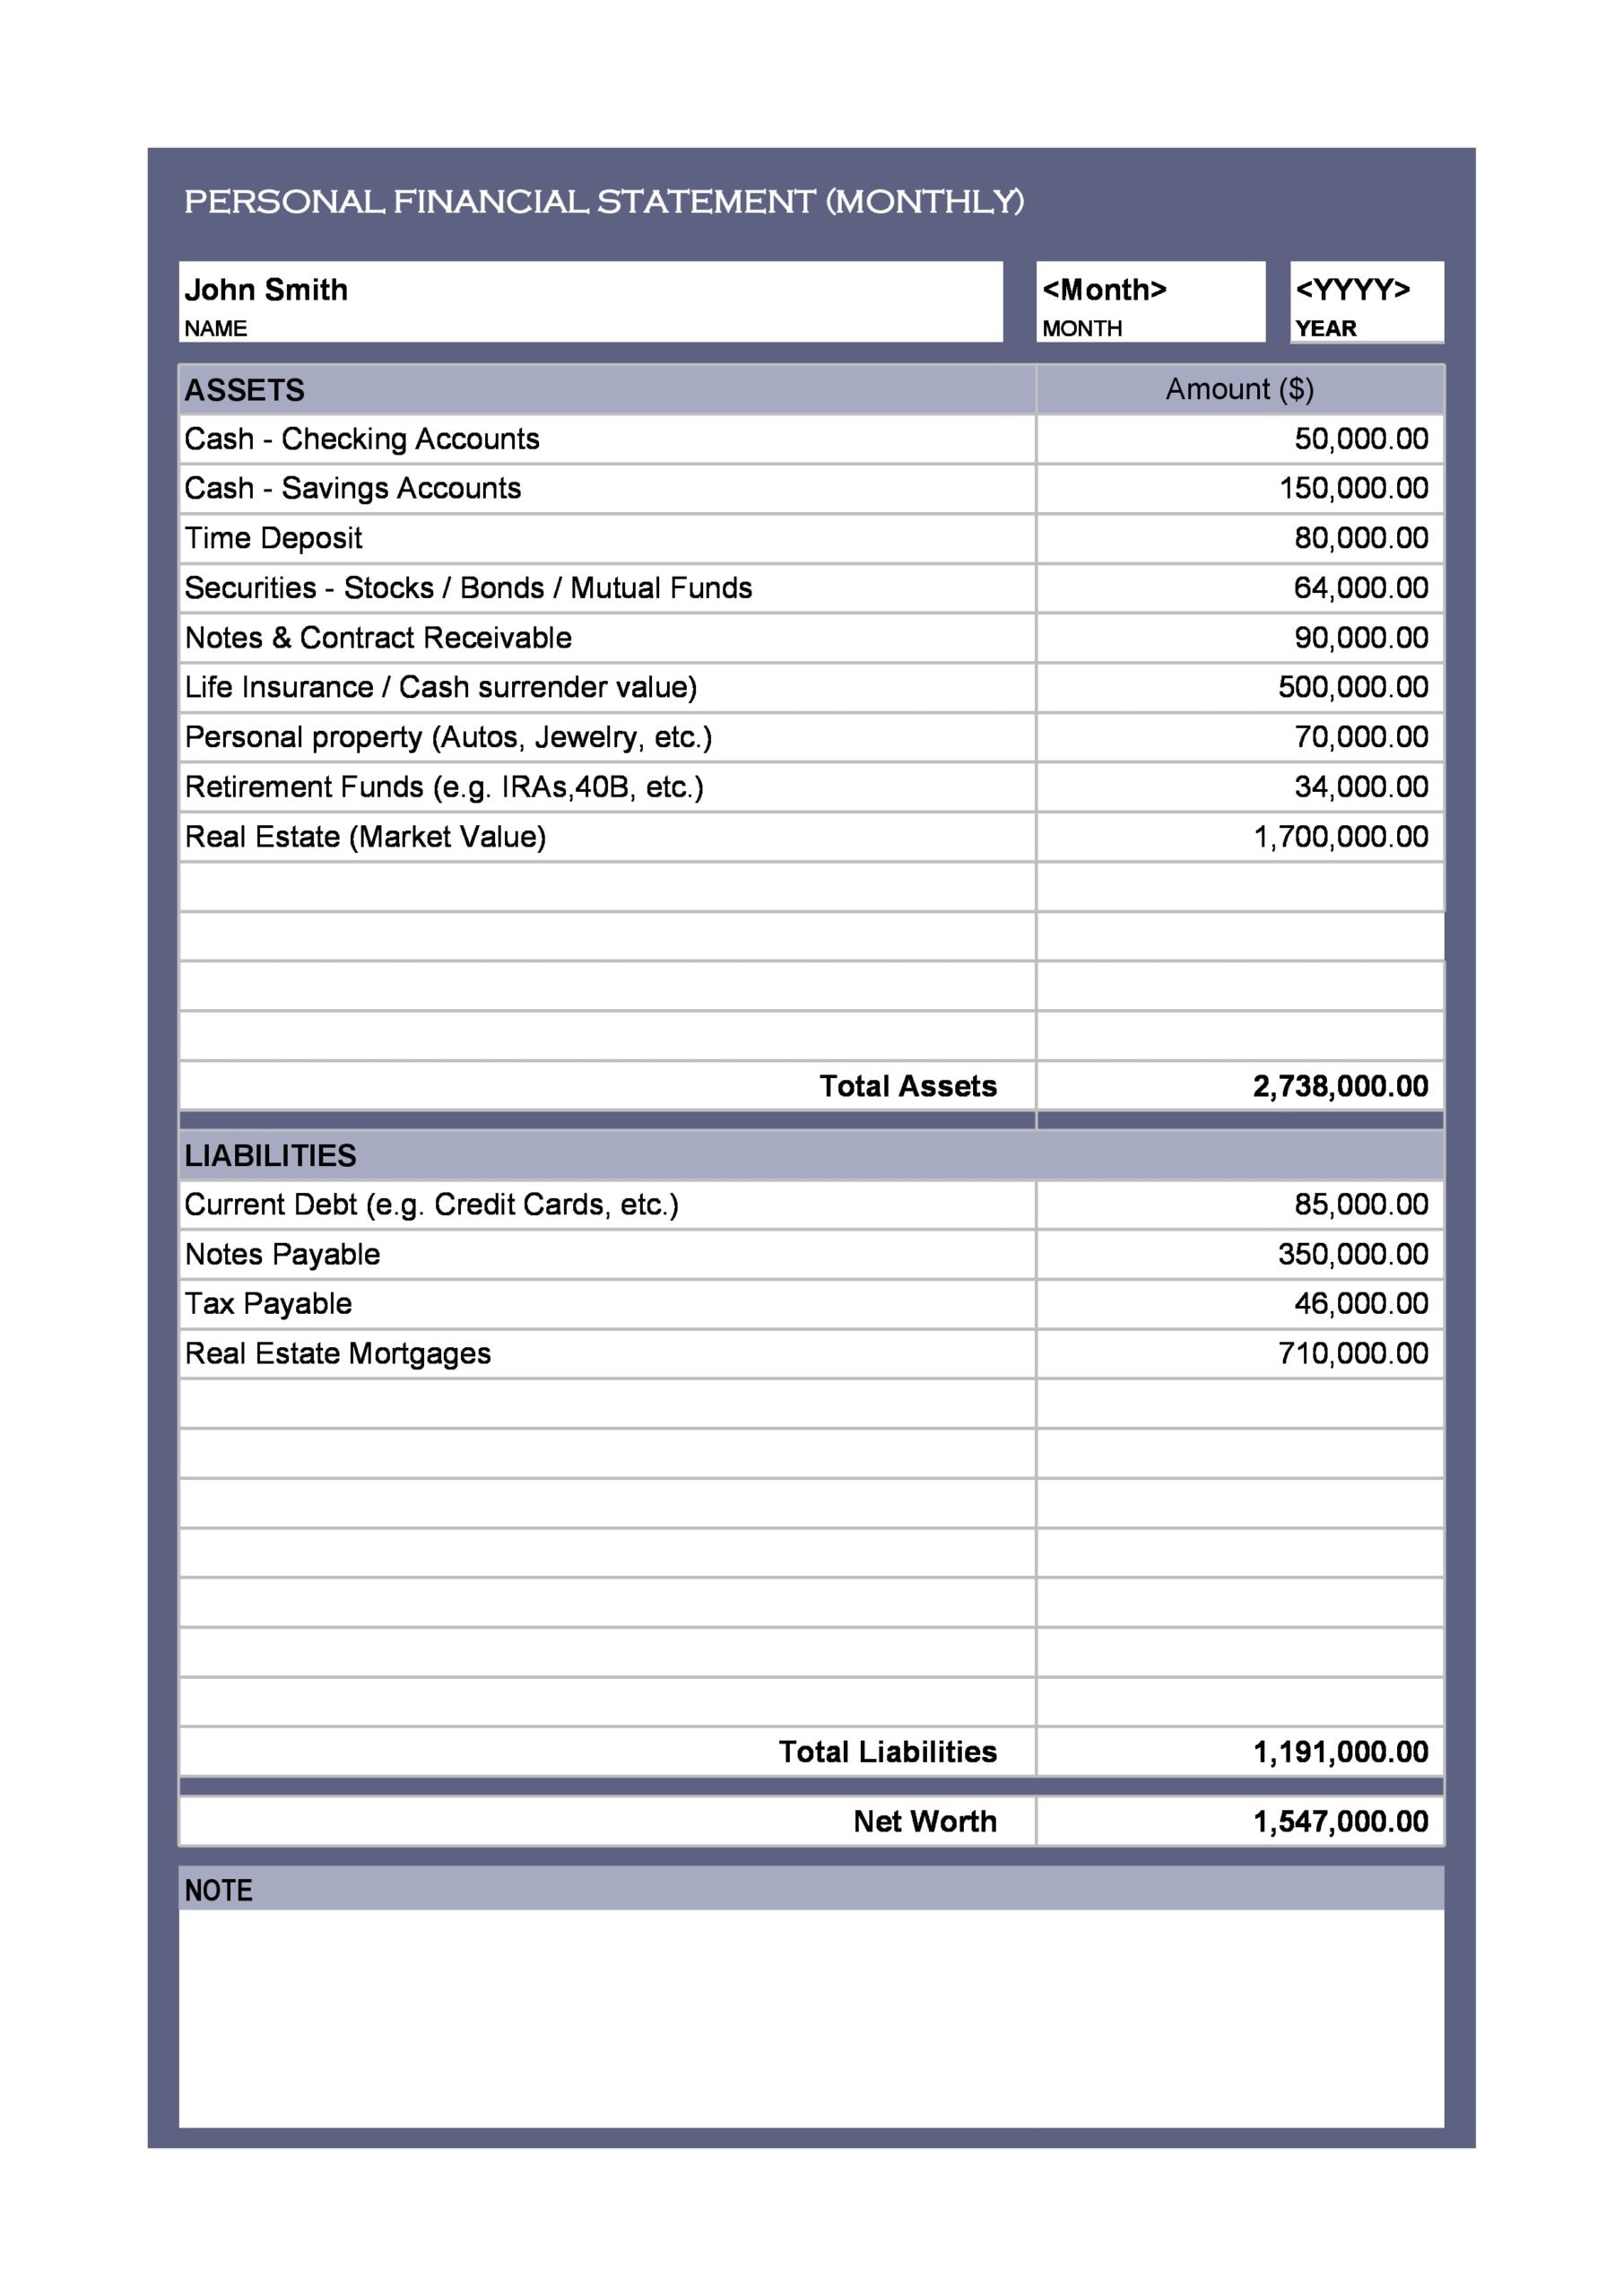
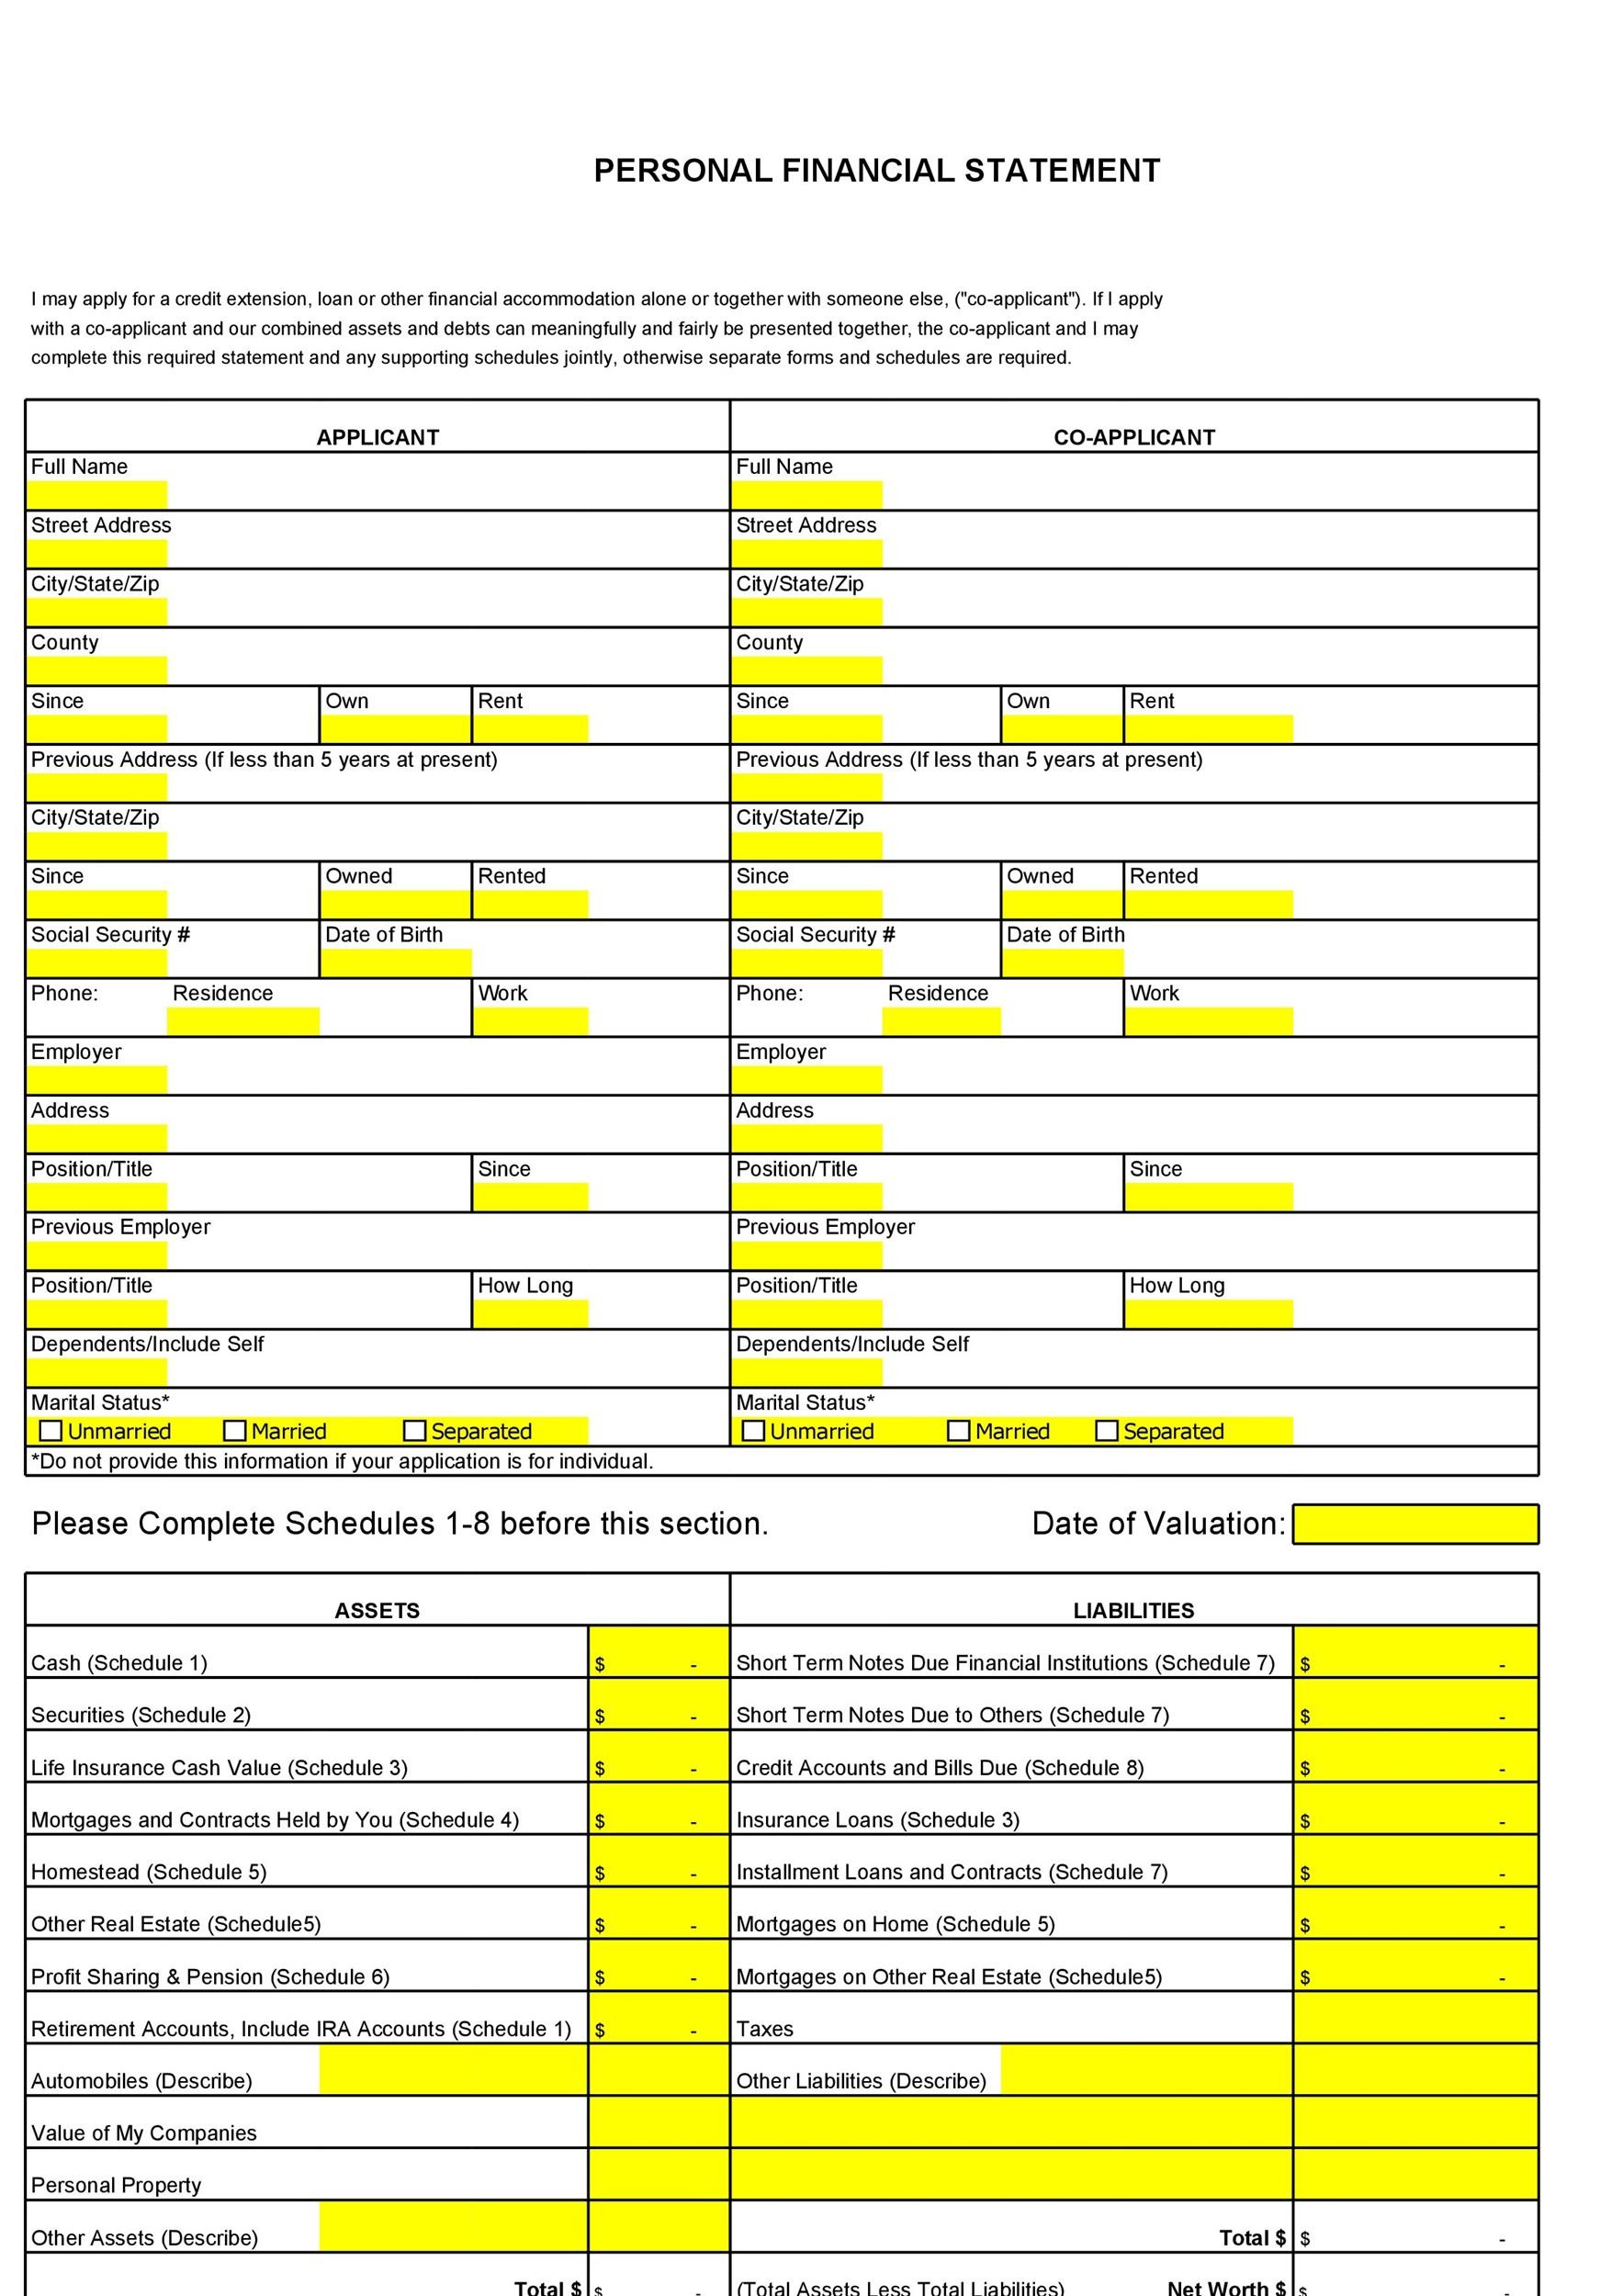
Financial Statement PDFs: Examples & Easy Explanations
When you open a financial statement PDF, the numbers may look like a maze, but the underlying story is often straightforward. Below we break down the most common statements, illustrate them with real‑world examples, and explain what each line really means. Think of it as a quick tour through the paperwork you’ll encounter whether you’re a small‑biz owner, a budding investor, or just curious about how companies keep score.
Why PDFs Still Rule the Reporting World
PDFs are the default format for official financial disclosures because they preserve formatting across devices and comply with regulatory filings. Unlike editable spreadsheets, a PDF guarantees that the numbers you see are exactly what the preparer intended.
That said, the medium doesn’t change the fundamentals: assets, liabilities, equity, revenue, and expenses. If you understand those building blocks, the PDF’s layout becomes a second nature.
The Core Trio of Financial Statements
Every complete set of financial PDFs will contain three core statements. Below each, you’ll find a brief example and a quick “what‑to‑watch‑for” note.
1. Balance Sheet (Statement of Financial Position)
- Sample line: Cash and cash equivalents – $125,000
- What it tells you: This figure sits on the asset side, showing liquidity at a specific point in time.
- Red flag: A sudden plunge in cash without a corresponding rise in short‑term debt could hint at cash‑flow stress.
The balance sheet follows the simple equation: Assets = Liabilities + Equity. If the numbers don’t balance, the PDF likely contains a typo or an omitted entry.
2. Income Statement (Profit & Loss)
- Sample line: Revenue – $820,000
- What it tells you: Top‑line sales before any costs are deducted; a good gauge of market demand.
- Red flag: Growing revenue paired with shrinking gross profit may signal rising production costs.
Net income sits at the bottom, painting the bottom‑line result after all expenses, taxes, and interest are accounted for. Comparing year‑over‑year net income helps spot genuine growth versus one‑off gains.
3. Cash Flow Statement
- Sample line: Cash provided by operating activities – $95,000
- What it tells you: The cash actually generated from core business operations, stripped of accounting adjustments.
- Red flag: Positive net income but negative operating cash flow could indicate aggressive revenue recognition.
Cash flow breaks down into operating, investing, and financing sections. The sum of these three tells you the net change in cash for the period—exactly what the balance sheet’s cash line should reflect.
Putting It All Together: A Mini Case Study
Imagine a fictional tech startup, BrightApps Inc. Its most recent PDF package includes the following snapshot:
- Balance Sheet: Total assets $1.2 million, total liabilities $450,000, equity $750,000.
- Income Statement: Revenue $2.0 million, cost of goods sold $800,000, net income $350,000.
- Cash Flow: Operating cash $300,000, investing cash –$150,000, financing cash $200,000.
What can we infer? First, the equity level is healthy—over half the company’s financing comes from owners, not creditors. Second, the profit margin (net income ÷ revenue) sits at roughly 17.5 %, respectable for a SaaS model. Third, the cash flow shows a positive operating boost, partially offset by a cash‑outlay for new servers (investing). The net cash increase of $350,000 matches the balance‑sheet cash rise, confirming the numbers line up.
Tips for Navigating Financial PDFs Efficiently
- Use the search function. Look for keywords like “cash,” “debt,” or “revenue” to jump straight to the line you need.
- Check footnotes. They often explain unusual items—stock‑based compensation, one‑time gains, or regulatory adjustments.
- Convert to Excel when needed. Many PDF readers let you export tables; that’s handy for quick ratio calculations.
- Watch the dates. Statements are snapshots (balance sheet) or period totals (income, cash flow). Mixing periods can lead to misleading conclusions.
Common Ratios to Pull From the PDFs
Once you’ve located the key numbers, a few ratios give a rapid health check.
- Current Ratio = Current Assets ÷ Current Liabilities. Values above 1.5 suggest short‑term stability.
- Debt‑to‑Equity = Total Liabilities ÷ Equity. A lower ratio typically means less financial risk.
- Return on Equity (ROE) = Net Income ÷ Equity. Higher figures indicate effective use of shareholders’ capital.
Plug the numbers from BrightApps’ example and you’ll see a current ratio of 2.2, debt‑to‑equity of 0.6, and ROE of 46 %—all signals of a robust, growth‑oriented firm.
When PDFs Hide Complexity
Not every PDF is a clean table. Some firms embed charts, narrative commentary, or multi‑segment breakdowns. In those cases, skim the narrative first; it often highlights the figures that matter most. Then dive into the tables for the exact numbers.
Occasionally, you’ll encounter “pro forma” statements—adjusted figures that exclude certain items. Treat them as supplemental, not the primary source, unless the company explicitly states they represent the normal operating picture.
Final Thought: PDFs Are a Tool, Not a Barrier
If you can read a balance sheet, decipher an income statement, and follow the cash flow, the PDF format is merely a wrapper. The real insight comes from asking the right questions: Is cash keeping pace with profit? Are liabilities growing faster than assets? And how does the story compare with industry benchmarks?
Armed with a few examples and a clear explanation of each line, you’ll find that financial statement PDFs are less intimidating and more like a well‑organized diary of a company’s financial life.