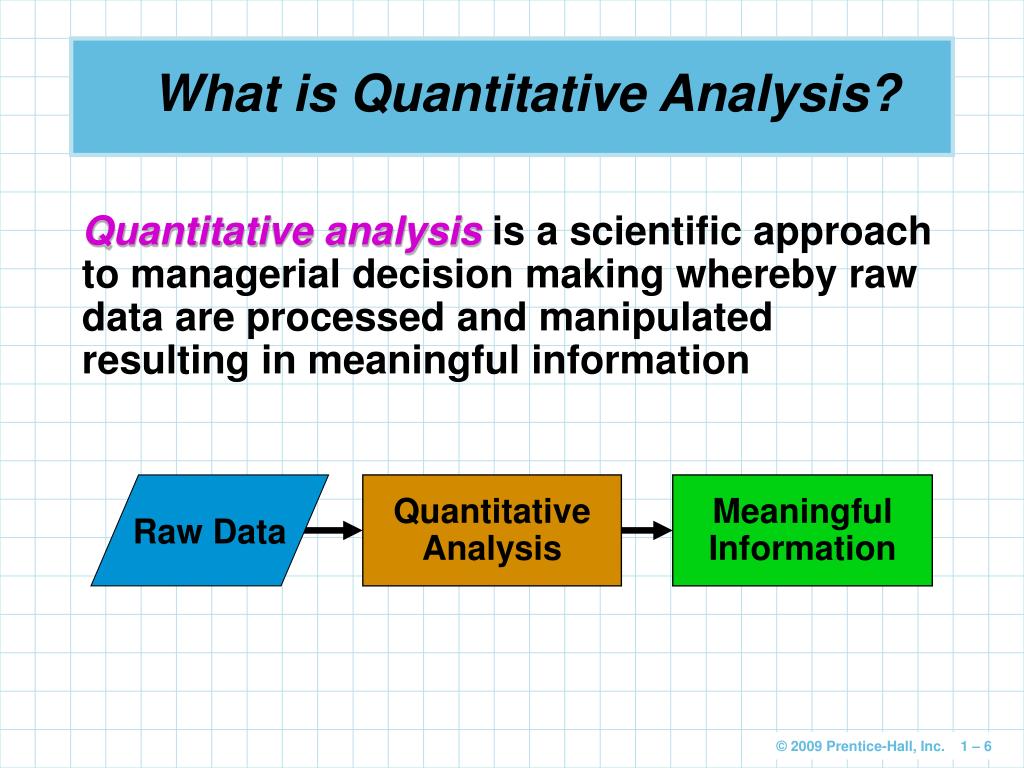
How Quantitative Analysis Transforms Decision‑Making
Why Numbers Matter More Than Gut Feeling
When a manager says “I just have a feeling this will work,” the instinct is understandable—but it’s rarely enough to convince investors, regulators, or even skeptical teammates. Quantitative analysis steps in as the neutral third party, converting vague impressions into concrete evidence. By grounding choices in data, you sidestep bias, reveal hidden patterns, and create a road map that can be tested and refined.
Core Components of a Robust Quantitative Approach
Most models share three building blocks, though the exact mix varies by industry.
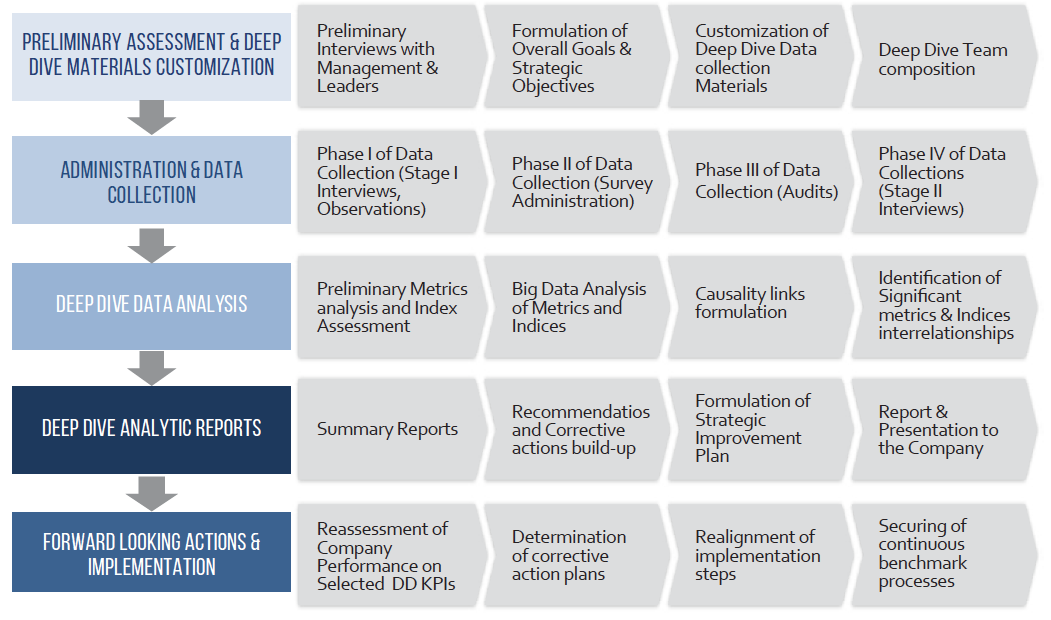
- Data Collection: Raw numbers gathered from surveys, sensors, financial statements, or web logs.
- Statistical Techniques: Regression, time‑series, Monte‑Carlo simulations, or Bayesian inference, depending on the question.
- Interpretation & Reporting: Translating outputs into actionable insights, often with visual aids.
Skipping any of these stages can turn a sophisticated model into a house of cards.
From Hypothesis to Insight: A Step‑by‑Step Walkthrough
1. Define the Question Clearly
Instead of “Will sales improve?” ask, “What is the projected percentage increase in quarterly sales if we raise price by 5 % while investing 2 % of revenue in digital ads?” The specificity determines the data you’ll need and the methods you’ll apply.
2. Gather Relevant, High‑Quality Data
Quality trumps quantity. A tidy spreadsheet of 10,000 flawless records beats a massive, error‑laden dump. Cleanliness means handling missing values, eliminating duplicates, and normalising units.
3. Choose the Right Model
Linear regression works well for straight‑line relationships, but if sales spike after a promotional event and then level off, a logistic or spline model may capture the curve more accurately. Don’t force a tool; let the data speak.
4. Validate and Stress‑Test
Cross‑validation, out‑of‑sample testing, or bootstrapping provide a reality check. If the model predicts wildly different outcomes when you tweak a single parameter, you’ve likely over‑fitted.
5. Communicate Findings Effectively
Numbers alone rarely move a boardroom. Pair charts with concise narratives: “A modest 5 % price hike, coupled with targeted ads, is projected to lift revenue by 3 % while keeping churn under 1 %.” Highlight assumptions, confidence intervals, and potential risks.
Common Pitfalls and How to Avoid Them
- Cherry‑picking data: Selecting only favorable periods inflates results. Use the full dataset or justify exclusions transparently.
- Ignoring correlation vs. causation: A spike in sales after a marketing campaign doesn’t prove the campaign caused the uptick. Seek controlled experiments or instrumental variables.
- Over‑reliance on software defaults: Built‑in settings can mask underlying issues. Adjust parameters consciously and document every change.
Real‑World Applications That Illustrate the Power of Quantitative Analysis
In finance, risk managers employ Value‑at‑Risk models to gauge potential losses under extreme market moves. In healthcare, researchers use survival analysis to predict patient outcomes based on treatment variables. Even sports teams now track player performance metrics to optimise line‑ups and contract decisions.
What ties these examples together? A disciplined, data‑driven process that turns raw numbers into strategic advantage.
Tools of the Trade: From Spreadsheets to Advanced Platforms
If you’re just starting, Excel or Google Sheets handle basic regression and pivot tables with ease. As complexity grows, consider R, Python’s pandas and scikit‑learn libraries, or dedicated statistical packages like SAS or Stata. Cloud‑based solutions—such as Tableau for visualization or Snowflake for data warehousing—add scalability for larger enterprises.
Putting It All Together: A Mini‑Case Study
Imagine a mid‑size e‑commerce firm contemplating a subscription model. The team asked: “Will a $9.99 monthly fee increase lifetime customer value?”
- They collected six months of purchase histories, churn rates, and average order values.
- Using a cohort analysis, they identified that repeat buyers already contributed 30 % of revenue.
- A probabilistic model projected a 12 % lift in lifetime value if 15 % of existing customers adopted the subscription, assuming churn drops by half for subscribers.
- Scenario testing showed the break‑even point at 9 % adoption, well below the realistic target.
- Armed with these numbers, the leadership approved a pilot, allocating budget only after the model’s confidence interval fell within acceptable risk thresholds.
The result? Within three months, adoption hit 13 %, and average revenue per user rose by 9 %, confirming the model’s foresight.
When Quantitative Analysis Isn’t Enough
Numbers illuminate, but they don’t capture every nuance. Cultural shifts, regulatory changes, or sudden geopolitical events can render even the best models obsolete overnight. Pair quantitative insights with qualitative inputs—expert interviews, market sentiment surveys, and scenario workshops—to build a fuller picture.
Bottom Line
Quantitative analysis isn’t a magic wand, but it is a reliable compass. By asking the right questions, curating clean data, selecting appropriate methods, and communicating clearly, you turn uncertainty into informed choices. In a world where every decision carries a cost, a data‑first mindset often proves the most economical strategy.