How Satellite Data Improves Storm Tracking and Forecasts
When a thunderhead rolls off the coast or a tropical disturbance gathers speed over open water, we all want to know where it’s headed. Modern satellites act like a giant, ever‑watchful eye in space, feeding meteorologists a constant stream of information that turns vague cloud pictures into actionable forecasts. Below, we’ll explore the technology behind those eyes, how the data is turned into storm‑tracking insights, and what it means for everyday weather watchers.
The Evolution of Satellite Meteorology
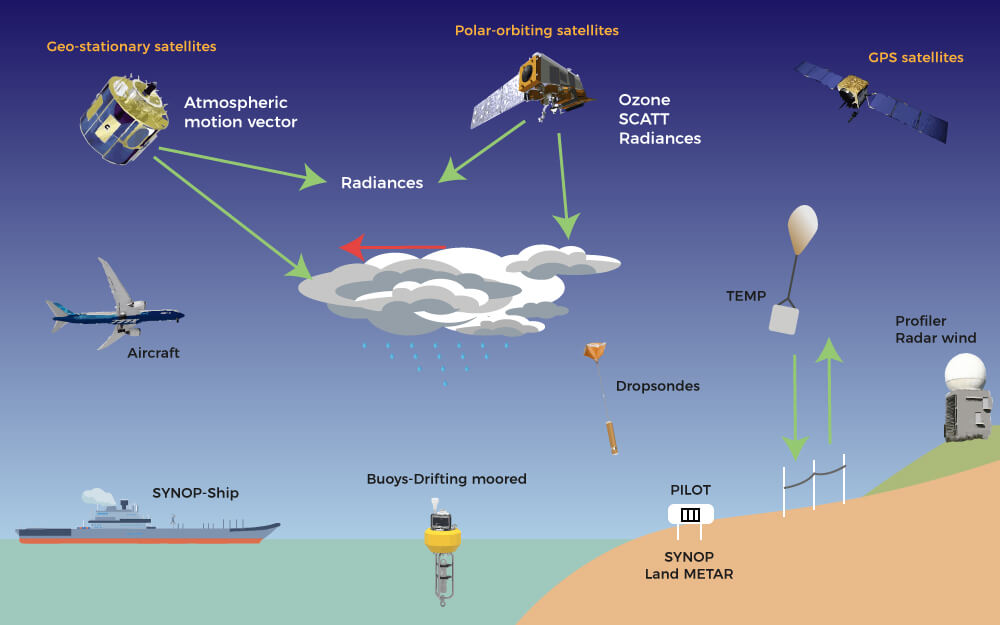
It wasn’t that long ago that forecasters relied on surface observations and occasional aircraft reports. The first weather satellites in the 1960s offered only black‑and‑white images, enough to spot a hurricane’s outline but not much else. Fast forward to today, and we have a fleet of geostationary and polar‑orbiting platforms equipped with high‑resolution cameras, microwave sensors, and lidar instruments.
These tools capture everything from visible light to infrared heat signatures, enabling us to see a storm’s structure day and night, through clouds and even rain. The result is a constantly updating, three‑dimensional view that can be shared worldwide within minutes.
Key Satellite Instruments for Storm Tracking
- Visible and Infrared Radiometers – Show cloud tops, temperature gradients, and movement.
- Microwave Sounders – Penetrate heavy precipitation to reveal wind speeds and moisture content.
- Lidar and Radar Altimeters – Measure surface wind gusts and sea‑level pressure.
- Scatterometers – Provide direct wind vector data over oceans, crucial for tropical cyclones.
Each instrument offers a different piece of the puzzle; together they give a comprehensive picture that no single sensor could achieve.
From Raw Data to Storm Insights
Satellites transmit terabytes of raw measurements to ground stations. Processing pipelines—often run on supercomputers—apply algorithms that convert brightness temperatures into wind estimates, infer rain rates, and even predict storm intensification. One popular method, the Advanced Dvorak Technique, blends visual patterns with infrared data to assign a “strength” number to tropical systems.
Once the data is processed, it feeds into numerical weather prediction models. These models simulate the atmosphere’s physics, allowing forecasters to run “what‑if” scenarios and see how a storm might evolve over the next 48 or 72 hours.
Case Study: Hurricane Ida (2021)
During Ida’s rapid intensification, satellite scatterometer data revealed a sudden spike in surface winds that ground stations hadn’t yet recorded. That early clue gave the National Hurricane Center an extra hour to issue a higher‑category warning, potentially saving lives along the Gulf Coast.
Why Satellite‑Based Tracking Beats Traditional Methods
Traditional observations—buoys, radar, and aircraft reconnaissance—are invaluable, yet they’re limited by geography and cost. A buoy can monitor a single point, radar struggles over open water, and reconnaissance flights are expensive and cannot be sustained around the clock.
Satellites, by contrast, offer:
- Global coverage, including remote oceanic regions where storms often form.
- Continuous monitoring, with updates every 5 to 15 minutes for geostationary platforms.
- Multi‑spectral data that can distinguish between rain, hail, and dry air intrusions.
This breadth of information translates into more accurate track forecasts, better intensity predictions, and ultimately more timely warnings for at‑risk communities.
Limitations and Ongoing Challenges
Even with all the advances, satellites aren’t a silver bullet. Cloud‑top temperature alone can mislead intensity estimates if a storm has a cold, high cirrus canopy but weak surface winds. Moreover, polar‑orbiting satellites revisit the same spot only a few times a day, leaving gaps in rapidly changing situations.
Researchers are working on solutions—higher‑frequency constellations, AI‑enhanced pattern recognition, and hypersonic launch platforms that could drop satellites into low‑orbit for ultra‑fast revisits. Until then, a hybrid approach that still values ground‑based data remains the best practice.
What This Means for the Everyday Weather Enthusiast
If you follow a storm online, you’ve probably seen satellite loops on news sites or social media. Knowing the basics can help you interpret what you’re seeing:
- Bright white tops indicate high, cold clouds—often a sign of strong updrafts.
- Deep orange or red in infrared images signals cooler cloud tops, which usually mean a more vigorous system.
- Wind vectors from scatterometers appear as tiny arrows; larger arrows mean faster surface winds.
Understanding these cues lets you gauge a storm’s potential before official advisories are issued, giving you a little extra heads‑up.
Future Outlook: The Next Generation of Storm‑Tracking Satellites
NASA’s upcoming JPSS‑2 and NOAA’s GEO‑K series promise sharper images and faster data relay. Meanwhile, private companies are launching constellations of small, low‑cost satellites that could fill the temporal gaps left by larger platforms. The goal? Near‑real‑time, high‑resolution data that makes it possible to predict sudden intensification minutes, not hours, in advance.
When those systems become operational, the line between “forecast” and “nowcast” will blur, offering communities the kind of precise, timely information that could change how we prepare for severe weather.