How Social Blade Reveals the Real Story Behind YouTube Subscriber Numbers
Ever wondered why a channel’s subscriber count sometimes jumps or dips in ways that seem too sudden to be genuine? The answer often lies in the data that powers the platform, and Social Blade is the most popular window into that world. Below we break down what the numbers really mean, how they’re calculated, and what creators (and fans) can learn from them.
What Social Blade Actually Tracks
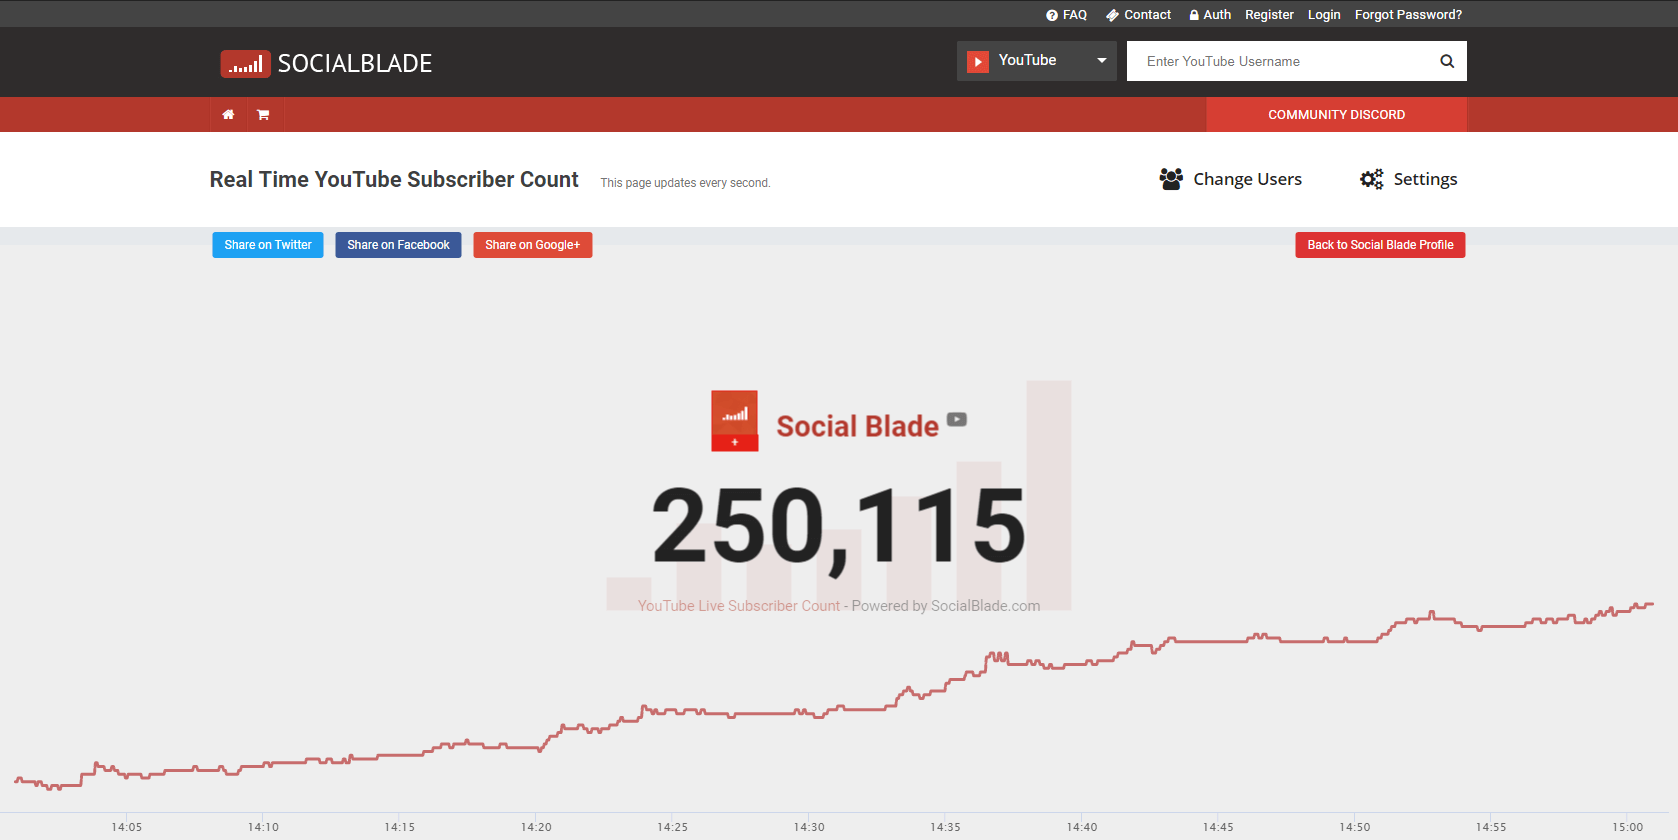
Social Blade aggregates publicly available statistics from YouTube’s API—primarily the subscriber total, view count, and upload frequency. It then applies its own algorithms to smooth out short‑term fluctuations, presenting a cleaner, more digestible trend line.
Key Metrics on a Channel’s Page
- Subscriber Count: The headline figure, updated roughly every 15‑30 minutes.
- Daily/Weekly Gain: Shows how many new followers the channel added over the selected period.
- Projected Future: A rough estimate based on recent growth patterns, useful for spotting momentum shifts.
- Engagement Ratios: Likes‑to‑views, comments‑to‑views, and similar ratios that give context to raw subscriber numbers.
Why Numbers Appear to “Jump”
One of the most common misconceptions is that YouTube’s subscriber total updates in real time. In reality, the platform batches updates, especially for larger channels. When Social Blade pulls fresh data, the displayed count can seem to leap forward, even though the real-time count on YouTube may have been inching up steadily.
Additionally, YouTube sometimes removes “spam” or “inactive” accounts from a channel’s tally. Those purges appear as sudden drops on Social Blade, but they’re actually a cleanup effort by the platform.
Understanding the “Subscriber Milestones” Feature
Social Blade highlights when a channel crosses thresholds like 10K, 100K, or 1M subscribers. These milestones are more than vanity—they often trigger eligibility for YouTube’s Partner Program benefits, such as live streaming and custom thumbnails. Watching how quickly a creator moves between milestones can hint at external factors, such as a viral video or a major collaboration.
How to Read the Graphs Without Getting Overwhelmed
The line chart on a channel’s profile is deceptively simple. Here’s a quick cheat sheet:
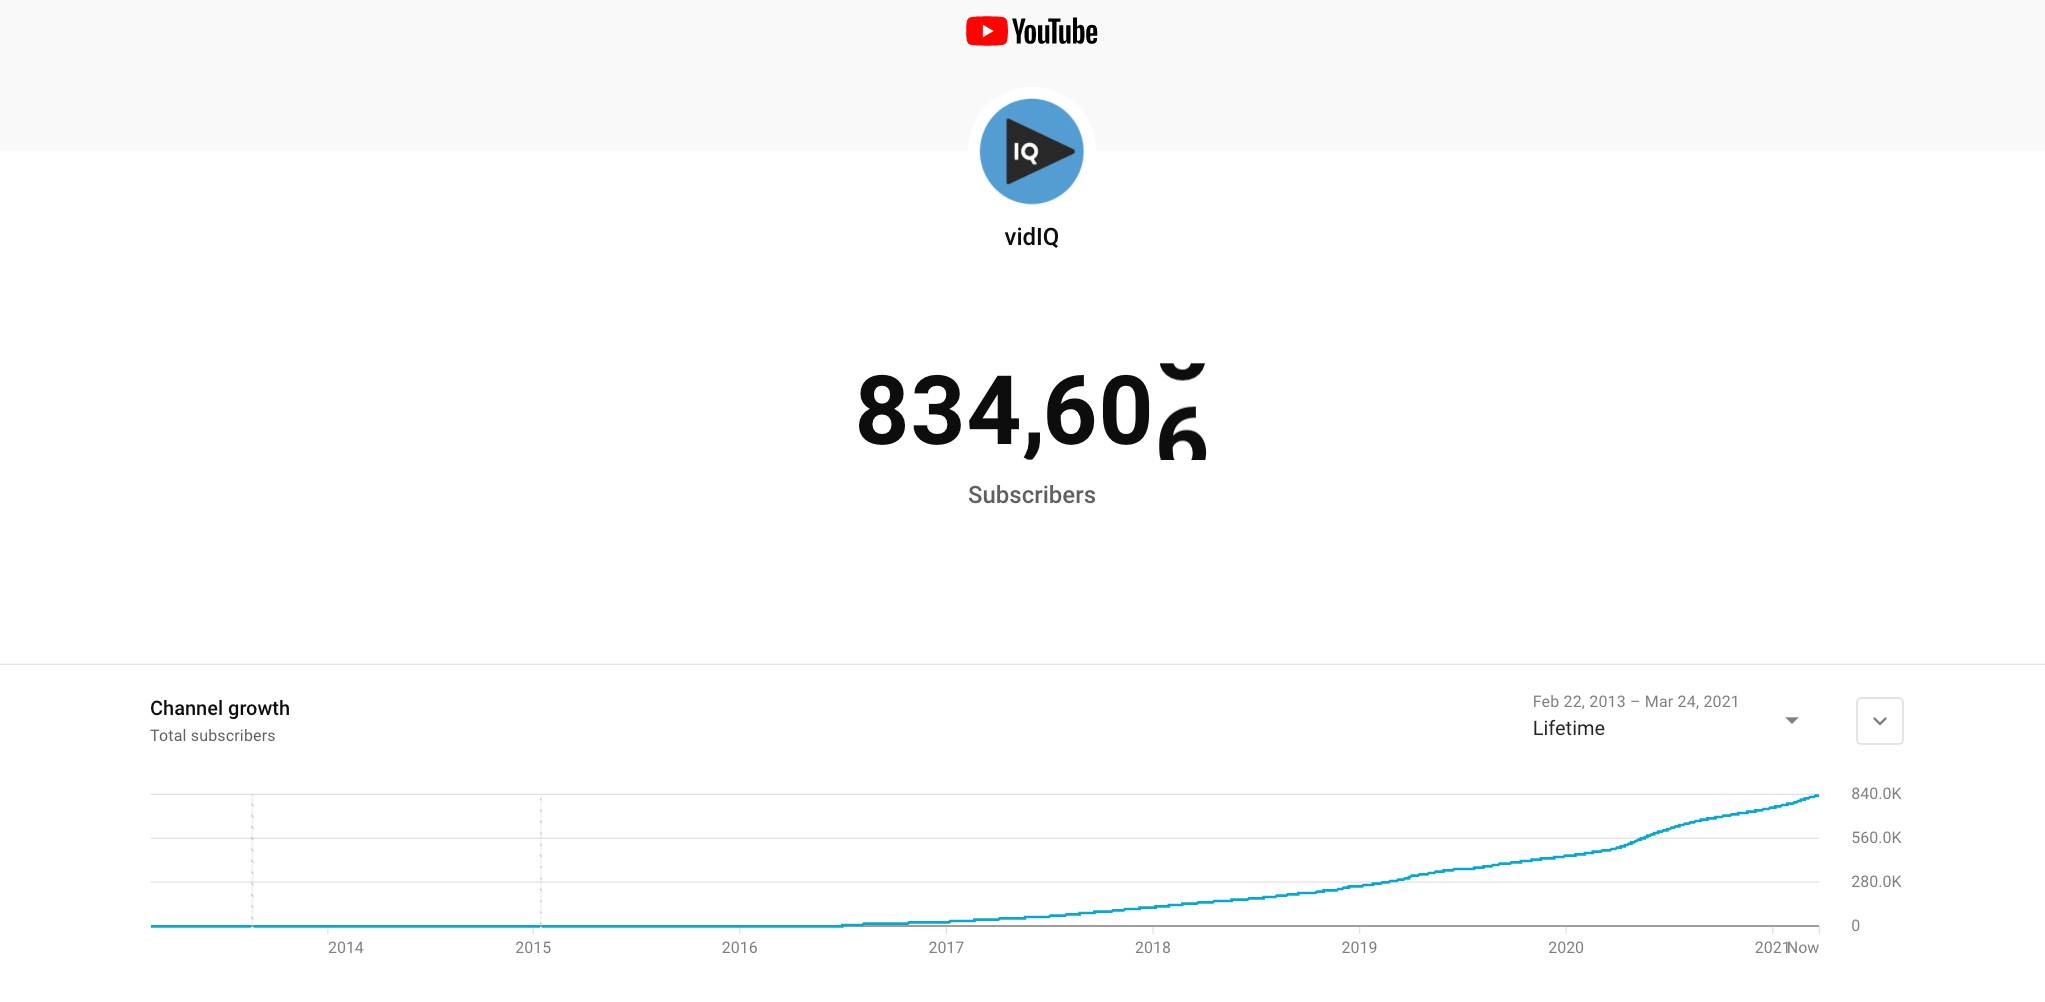
- Steady upward slope: Consistent growth, usually driven by regular uploads and audience retention.
- Sharp spikes: Usually tied to a single piece of content that went viral.
- Plateaus: Could indicate a content shift, algorithm change, or simply a period of slower output.
- Downward dips: May be a result of subscriber purges, or a series of less‑engaging videos.
Remember, a single data point rarely tells the whole story. Look at the broader trend over weeks or months before drawing conclusions.
What Creators Can Do With This Insight
For anyone building a channel, Social Blade isn’t just a vanity metric; it’s a diagnostic tool. Here’s how creators often use it:
- Identify the exact upload that caused a subscriber surge and replicate its style.
- Spot periods of stagnation and experiment with new formats or collaborations.
- Monitor competitor channels to gauge market saturation and find gaps.
- Validate claims about growth—if a channel boasts a sudden “10K‑in‑24‑hours” claim, Social Blade can confirm or refute it.
Limitations and Caveats
While Social Blade is a fantastic resource, it’s not infallible. The platform relies on the same public API that YouTube offers, meaning:
- Data may lag by up to an hour for very large channels.
- Hidden metrics like “watch time” or “average view duration” aren’t displayed, yet they heavily influence YouTube’s recommendation engine.
- Third‑party extensions that claim to provide “real‑time” subscriber alerts often scrape the same data, so they’re not truly faster.
In short, treat Social Blade as a reliable compass, not an exact GPS.
Practical Tips for Fans Who Want to Track Their Favorite Creators
If you’re the kind of subscriber who loves to see a channel’s growth curve, here are a few low‑effort habits:
- Bookmark the Social Blade page and refresh it once a day—no need to obsessively check every hour.
- Set up a simple Google Sheet to log weekly subscriber totals; over time you’ll spot patterns you’d miss by looking at a single graph.
- Use the “Future Projections” tab as a conversation starter in comment sections—ask creators what they think is driving the trend.
Wrapping Up the Numbers Game
At its core, Social Blade translates raw YouTube data into a story you can actually read. By understanding how subscriber counts are gathered, why they sometimes appear to jump, and what the visual trends really signify, both creators and fans can make smarter, more informed decisions. The next time you see a channel’s subscriber line spike, you’ll know exactly where to look for the underlying cause—and maybe even anticipate the next surge yourself.