How to Calculate Portfolio Risk — Step‑by‑Step Examples
Investors often wonder whether their portfolio can survive a market shake‑up. The answer lies in quantifying risk, not just guessing. Below we break down the essential concepts, walk through practical formulas, and illustrate each step with clear examples. By the end you’ll have a usable toolkit for measuring the volatility of any mix of assets.
Why Measuring Risk Matters
Risk isn’t a villain; it’s a compass. Knowing how much your holdings can swing helps you set realistic return expectations, allocate capital wisely, and avoid unpleasant surprises when headlines turn grim. In short, a solid risk calculation turns speculation into strategy.
Core Concepts You Need
- Standard Deviation – the most common gauge of how much individual returns deviate from their average.
- Covariance – shows how two assets move together; essential for diversified portfolios.
- Correlation Coefficient (ρ) – a normalized version of covariance ranging from –1 to 1.
- Beta – measures a security’s sensitivity to a benchmark, often the market index.
Step‑by‑Step Risk Calculation
1. Gather Historical Returns
Pull monthly (or weekly) price data for each asset over a consistent period—typically the last three to five years. Convert price changes into percentage returns.
2. Compute Individual Standard Deviations
For each asset, calculate the average return (μ) and then use the formula:
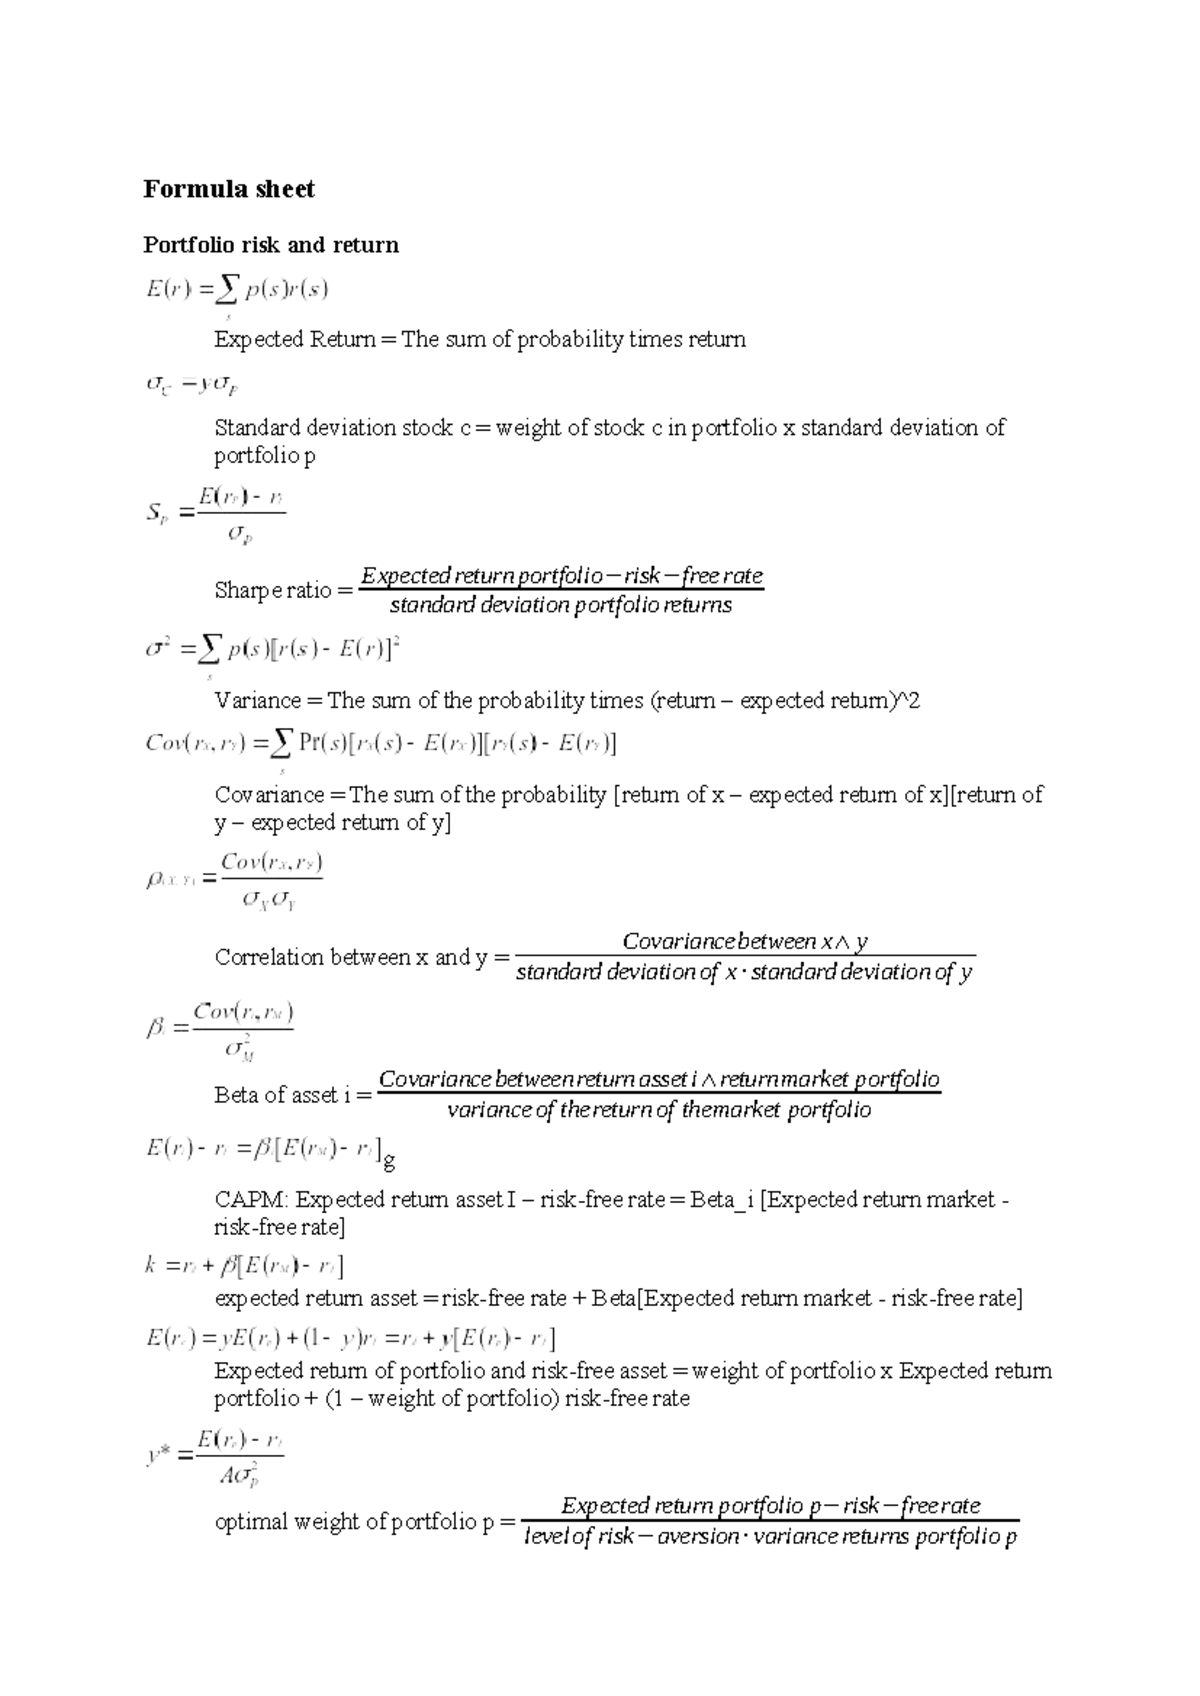
σ = √[ Σ (Rᵢ – μ)² / (N‑1) ]
where Rᵢ is each period’s return and N is the number of observations.
3. Build the Covariance Matrix
Pair every asset with every other asset, applying:
Cov(A,B) = Σ (R_Ai – μ_A)(R_Bi – μ_B) / (N‑1)
The resulting matrix captures how assets interact.
4. Translate Covariance to Correlation
Divide each covariance by the product of the two assets’ standard deviations:
ρ(A,B) = Cov(A,B) / (σ_A × σ_B)
This step makes the relationships easier to interpret.
5. Assemble Asset Weights
Decide how much of the portfolio each asset represents (w₁, w₂, …, wₙ). Weights must sum to 1 (or 100 %).
6. Calculate Portfolio Variance
Use the matrix and weights in the compact formula:
σ_p² = wᵀ Σ w
In plain English, multiply each weight by the corresponding row of the covariance matrix, then sum the products and finally multiply by the weight column.
7. Derive Portfolio Standard Deviation
Take the square root of the variance:
σ_p = √σ_p²
This final number is the portfolio’s risk, expressed as a standard deviation of returns.
Concrete Example: A Three‑Asset Portfolio
Let’s walk through a simple case with three stocks: Alpha (A), Beta (B), and Gamma (C). Assume monthly returns over the past 12 months are already calculated.
- Average returns: μ_A = 1.2 %, μ_B = 0.8 %, μ_C = 1.5 %
- Standard deviations: σ_A = 4.5 %, σ_B = 3.8 %, σ_C = 5.2 %
- Covariances (in %²):
- Cov(A,B) = 0.012
- Cov(A,C) = 0.018
- Cov(B,C) = 0.009
- Weights: w_A = 0.40, w_B = 0.35, w_C = 0.25
First, build the covariance matrix Σ:
| A | B | C | |
|---|---|---|---|
| A | 0.020 | 0.012 | 0.018 |
| B | 0.012 | 0.014 | 0.009 |
| C | 0.018 | 0.009 | 0.027 |
Next, perform the matrix multiplication:
σ_p² = [0.40 0.35 0.25] × Σ × [0.40 0.35 0.25]ᵀ
= 0.40²·0.020 + 0.35²·0.014 + 0.25²·0.027 + 2·0.40·0.35·0.012 + 2·0.40·0.25·0.018 + 2·0.35·0.25·0.009
≈ 0.0032 + 0.0017 + 0.0017 + 0.0034 + 0.0036 + 0.0016 = 0.0152
Finally, the portfolio standard deviation:
σ_p = √0.0152 ≈ 12.3 %
So, this mix of three equities carries an annualized risk of roughly 12 %. Compare that to each stand‑alone stock (4–5 %); diversification lowered the overall volatility—though not to the level of the lowest‑risk component because the assets still move together to some extent.
Adding a Risk‑Free Asset: The Classic Two‑Fund Separation
Many investors blend a risky portfolio with cash or Treasury bills. The combined risk is simply the risky portion’s standard deviation multiplied by its weight:
σ_total = w_risky × σ_risky
If you allocate 60 % to the three‑stock mix above (σ = 12.3 %) and 40 % to a risk‑free rate, the overall portfolio standard deviation becomes 0.60 × 12.3 % ≈ 7.4 %.
Practical Tips for Ongoing Risk Management
- Refresh data regularly. Market dynamics shift; a six‑month look‑back may miss emerging correlations.
- Use longer horizons for strategic decisions. Short‑term volatility can be noisy, while longer periods reveal structural risk.
- Stress‑test scenarios. Adjust returns by plausible shocks (e.g., a 10 % drop) and recompute risk to see potential impacts.
- Mind the “tail”. Standard deviation assumes normal distribution, which underestimates extreme moves. Consider Value‑at‑Risk (VaR) or Conditional VaR for a fuller picture.
Bottom Line
Calculating portfolio risk isn’t rocket science, but it does demand a systematic approach: gather data, compute individual volatilities, understand how assets co‑move, and finally blend everything with the weights you actually use. The example above shows how a handful of numbers translates into a clear risk metric you can compare, adjust, and communicate. Keep the process rolling, and you’ll turn risk from a vague worry into a concrete, manageable component of your investment strategy.