How to Master iReport Designer 5.6.0: A Complete Guide
Why iReport Designer Still Matters
Even though JasperReports Studio has taken the spotlight, many legacy projects still rely on iReport Designer 5.6.0. The tool offers a visual drag‑and‑drop canvas, built‑in SQL query builder, and a rich palette of components that let you sketch complex reports without writing a single line of Java code. If you’ve inherited an old codebase or need to maintain an existing suite of PDFs, learning the quirks of this version can save hours of debugging.
Getting Started: Installation and First Launch
iReport 5.6.0 runs on any JVM that supports Java 6 or newer. Download the installer from the official Jaspersoft archives, then run the .exe (Windows) or .sh (Linux/macOS) file. During setup you’ll be asked whether to register the default JasperReports library path—accept it unless you maintain a custom lib folder.
- Verify the installation by launching iReport and checking the About dialog for version 5.6.0.
- Configure the JDK path under Tools → Options → JasperReports if the auto‑detect fails.
- Optional: Install the iReport plug‑in for NetBeans if you prefer an integrated development environment.
Understanding the Workspace
The main window splits into three zones: the Report Inspector on the left, the central Design Canvas, and the Properties pane on the right. The Inspector mirrors the report hierarchy—report header, page header, detail band, and so forth. Clicking any band highlights its margins on the canvas, letting you resize or reposition elements with a mouse.
One subtle point that trips newcomers is the difference between static text and text fields. Static text is literal; it never changes at runtime. Text fields, on the other hand, evaluate an expression each time the report runs, which is essential for dynamic data like dates or totals.
Connecting to Data: Data Sources and Queries
iReport 5.6.0 supports a variety of data sources: JDBC connections, CSV files, XML, and even custom Java beans. To create a JDBC source, go to Data → Connections/Datasources, click New, and fill in the driver class, URL, username, and password. Test the connection before you close the dialog.
When you drag a table component onto the canvas, iReport automatically opens the query designer. Here you can write raw SQL or use the visual query builder to select tables, join them, and apply filters. Remember to preview the query result with the Preview button; it shows a sample of rows that will populate the detail band.
Designing Layouts: Bands, Elements, and Styles
Reports are built from bands that repeat in a predictable order: title, page header, column header, detail, column footer, page footer, and summary. Each band can host any number of elements—texts, images, charts, or sub‑reports.
For a clean look, define a style in the Report Inspector under Styles. A style can set font family, size, alignment, and border attributes. Apply the style to multiple elements; later you can tweak the style once and see the change everywhere.
- Static Text: Use for labels like “Customer Name”.
- Text Field: Bind to a field, e.g.,
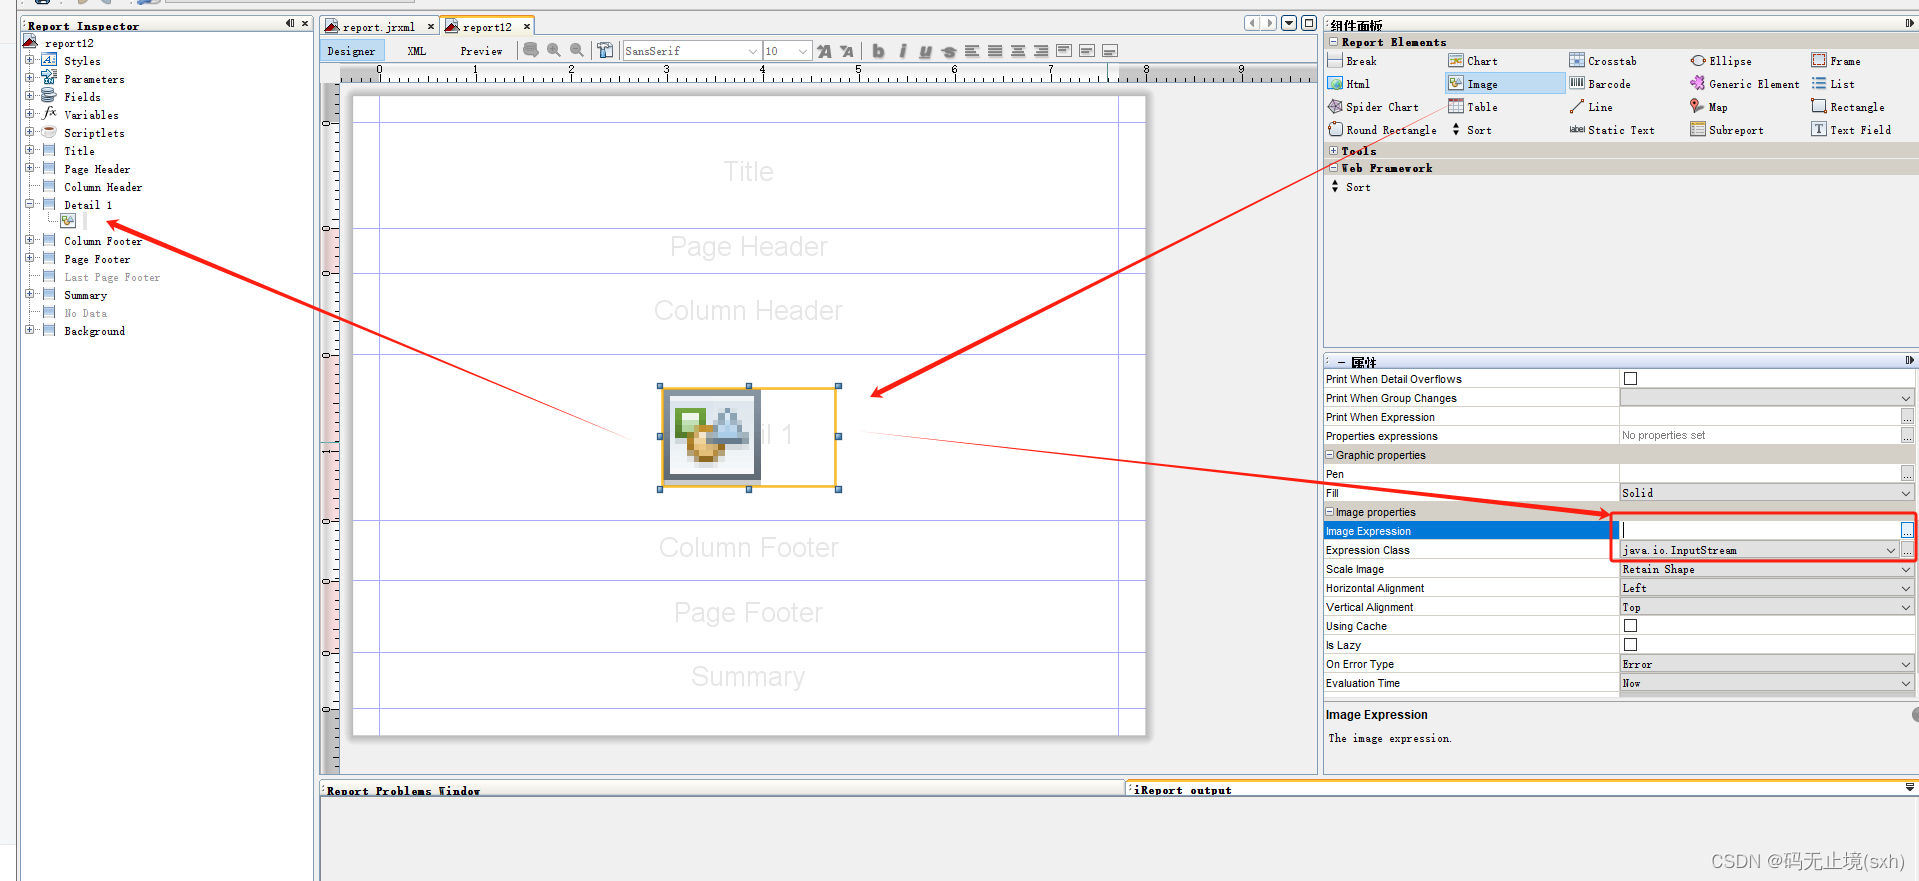
$F{customer_name}. - Image: Reference a file path or a URL; set “Scale Image” to “Retain Shape”.
- Chart: Choose from bar, line, pie; feed it a dataset built from a sub‑query.
Working with Expressions
Expressions in iReport are written in Java syntax. The most common pattern is the field reference—$F{field_name}. You can also use built‑in variables like $V{PAGE_NUMBER} or parameters that you define under Parameters. A handy trick is to concatenate strings directly in the expression, for example:
"Order #: " + $F{order_id}
If you need conditional logic, the ternary operator works well:
$F{quantity} > 0 ? "In Stock" : "Backorder"
Previewing and Exporting
Click the Preview tab to generate a PDF on the fly. The preview window shows exactly what end users will see, including pagination. If the layout looks off, toggle the “Show Grid” option to align elements more precisely.
Export options sit under File → Export. Besides PDF, you can produce HTML, XLS, RTF, and CSV. When exporting to Excel, consider checking “Ignore Pagination” to avoid empty rows between report pages.
Troubleshooting Common Pitfalls
Blank Pages: Often caused by band heights exceeding the page height. Reduce the margin or shrink the detail band.
Missing Data: Verify that the field name in the expression matches the column name returned by the query. Field names are case‑sensitive in some JDBC drivers.
Performance Lag: Large result sets can slow down preview. Use the “Limit” field in the query designer to fetch only the first 100 rows while you design, then remove the limit before production.
Best Practices for Long‑Term Maintenance
- Keep the report structure flat—avoid nesting sub‑reports unless absolutely necessary.
- Document each parameter and field in the report’s Properties description box; it helps future developers understand the data flow.
- Store the .jrxml files in version control alongside the source code; the compiled .jasper files can be regenerated on each build.
- Regularly test the report against a staging database to catch schema changes early.
FAQ
Can I use iReport Designer 5.6.0 on macOS?
Yes. The installer includes a macOS bundle, and the application runs on any Java 6+ VM. Just ensure you grant execute permissions on the .app package.
How do I add a custom font to iReport?
Place the TrueType font file in the fonts directory of the iReport installation, then refresh the font list via Tools → Options → Fonts. After that you can select the new font in the style editor.
Is it possible to embed images stored in a database?
Yes. Define a Blob field in your query, then use an Image component with the expression $F{image_blob}. Set the image expression class to java.io.InputStream for proper rendering.
What’s the difference between a sub‑report and a table component?
A sub‑report runs a separate JasperReport file, giving you full control over its layout and data source. A table component, introduced in later iReport versions, is lighter and ideal for simple tabular data without the overhead of an extra .jrxml file.