How to Monitor PSEi, KLCI and Other Stocks with Google Finance
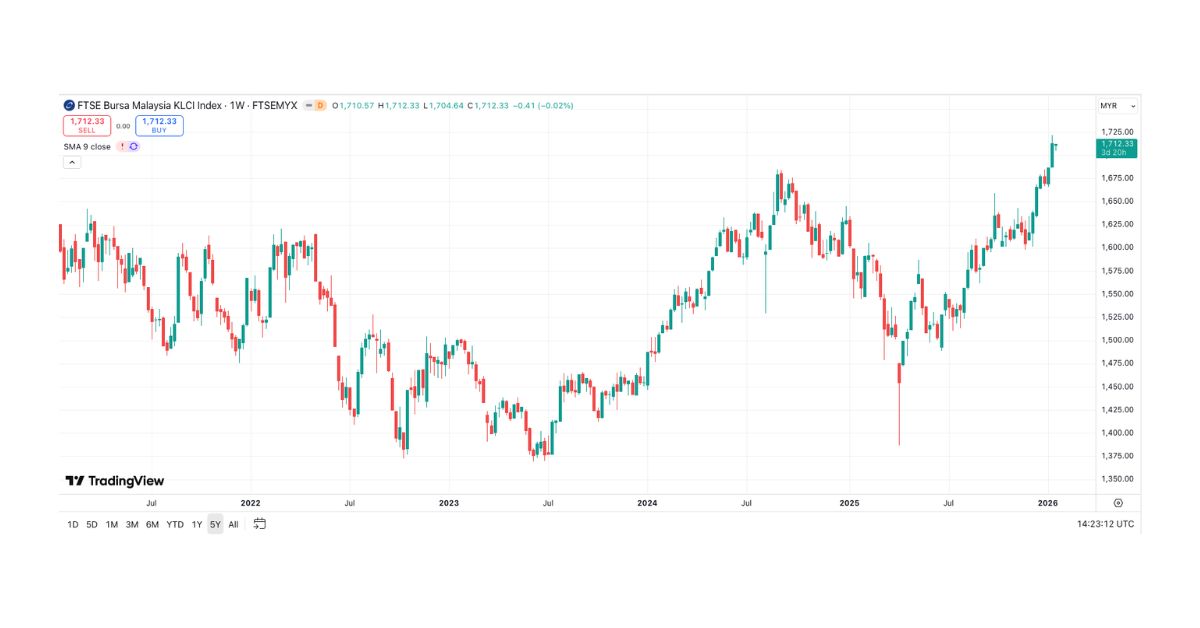
Investors in the Philippines, Malaysia and beyond often wonder where to find a single place that aggregates the most‑watched indices without forcing them to juggle multiple platforms. Google Finance, a surprisingly robust yet under‑used tool, lets you track the Philippine Stock Exchange Index (PSEi), the Kuala Lumpur Composite Index (KLCI) and a host of other equities—all from one clean dashboard. Below we walk through setting up your watchlist, interpreting the data, and getting the most out of the features that matter most.
Why Choose Google Finance Over Dedicated Broker Apps?
Most trading apps excel at order execution, but they can feel cluttered when you simply want a snapshot of market performance. Google Finance offers:
- Real‑time-ish quotes (delayed by a few minutes, which is sufficient for most retail investors).
- Customizable charts that let you toggle between line, candlestick and area views.
- News aggregation tied directly to each ticker, sourced from reputable outlets.
- Cross‑market comparison without leaving the page – you can line up PSEi against KLCI, S&P 500, or any other index you care about.
All of this lives in a Google‑powered environment, meaning you can pull up your portfolio on a laptop, tablet or phone with the same ease.
Step‑by‑Step: Setting Up a Watchlist for PSEi and KLCI
1. Open Google Finance
Visit google.com/finance and sign in with your Google account. If you skip signing in, you’ll still see data, but a personalized watchlist requires an account.
2. Search for the Indexes
In the search bar, type “PSEi” and select the official Philippine Stock Exchange Index from the dropdown. Repeat the process for “KLCI”. Google often tags the correct symbol with the country code, e.g., PSEI:INDEXPH and KLCI:INDEXMY.
3. Add to Your Watchlist
Click the “+ Follow” button on each index page. The icons will shift, confirming the addition. Your watchlist appears on the left‑hand sidebar under “Your Markets”.
4. Customize the View
Hover over the watchlist name and hit the three‑dot menu. Here you can:
- Rename the list (e.g., “Southeast Asia Benchmarks”).
- Reorder items by dragging them.
- Choose a default time frame for charts—1 day, 5 days, 1 month, etc.
Interpreting the Data: What the Numbers Really Mean
The main screen shows price, change (both absolute and percentage), and a tiny sparkline that hints at recent momentum. For deeper insight:
- Historical Data Tab: Pull up a table of daily closes for the past year. This is handy when you want to calculate simple moving averages on your own.
- Comparison Feature: Click “Compare” and type another ticker, such as “^GSPC” for the S&P 500. The overlay instantly reveals how the Philippine or Malaysian market is moving relative to global trends.
- News Feed: Scroll down to see the latest headlines affecting each index. Clicking a story opens the full article, often with embedded charts that mirror Google’s data.
While Google Finance isn’t a substitute for professional analysis, the combination of price action, news, and easy charting provides a solid foundation for casual investors.
Beyond Indices: Adding Individual Stocks and ETFs
If you’re already monitoring PSEi and KLCI, you probably have a few favorite stocks—say, SM Investments Corp. or Petronas Dagangan Bhd.. Add them the same way you added the indices, then:
- Set price alerts by clicking the bell icon on the stock’s page. Google will email you when the price crosses your threshold.
- Use the “Add to Portfolio” option (found under the “More” menu) to track your holdings alongside market benchmarks.
- Experiment with the “Performance” tab to see dividend yield, earnings per share, and other fundamentals—presented in a concise, digestible format.
Tips for Staying Efficient
Even a streamlined tool can become noisy if you overload it. Consider these habits:
- Limit the watchlist to 10‑15 items. Anything more starts to dilute focus.
- Schedule a quick glance. A 5‑minute morning routine—open Google Finance, glance at the sparkline, note any news spikes, then move on.
- Leverage the mobile app. The Google Finance app mirrors the desktop experience, but pushes notifications more reliably.
What About Data Accuracy?
Google Finance pulls its numbers from third‑party providers, typically with a 2‑minute delay for most free users. If you need sub‑second quotes for day‑trading, a brokerage platform remains the better choice. However, for portfolio monitoring, trend spotting, and casual research, the delay is negligible.
Integrating Google Finance With Other Tools
Power users often export data to spreadsheets for custom calculations. Here’s a quick way to do it:
- Open the “Historical Data” tab for your chosen ticker.
- Click “Download CSV”.
- Open the file in Google Sheets—now you can apply formulas, create pivot tables, or even link the sheet to a Google Data Studio dashboard.
This workflow bridges the gap between the simplicity of Google Finance and the analytical depth of spreadsheet modeling.
Final Thoughts
Whether you’re a Filipino investor wanting to keep an eye on the PSEi, a Malaysian trader tracking the KLCI, or simply someone who enjoys comparing regional markets, Google Finance offers a surprisingly capable, low‑maintenance solution. By setting up a tailored watchlist, customizing charts, and leveraging alerts, you can stay informed without drowning in data. The best part? It’s all free, cloud‑based, and just a click away the next time you open your browser.
![[Finterest] What is the PSEi, and why does it matter?](https://www.rappler.com/tachyon/2021/02/Philippine-Stock-Exchange-February-5-2021-001.jpg?resize=1400%2C933&zoom=0.5)