How to Track Vanguard Growth ETF Price Effectively
When you’re scanning the market for a growth‑focused fund, the Vanguard Growth ETF (VUG) often pops up. But spotting the current price is just the tip of the iceberg; you also want to know where it’s headed and what drives those movements. Below is a practical walk‑through that shows you the tools, tricks, and timing cues you can use to stay on top of VUG’s price without drowning in data.
Why the Price Matters (And When It Doesn’t)
At first glance, the ticker’s price looks like a simple snapshot: you see a number, you decide whether to buy or sell. In reality, the price is a reflection of three broader forces:
- Underlying holdings: VUG tracks a basket of large‑cap growth stocks, so shifts in those companies ripple through the ETF.
- Market sentiment: Investor mood around tech and consumer discretionary sectors can swing the ETF up or down in a single session.
- Liquidity and demand: Heavy buying or selling by institutions can create short‑term price gaps that aren’t tied to fundamentals.
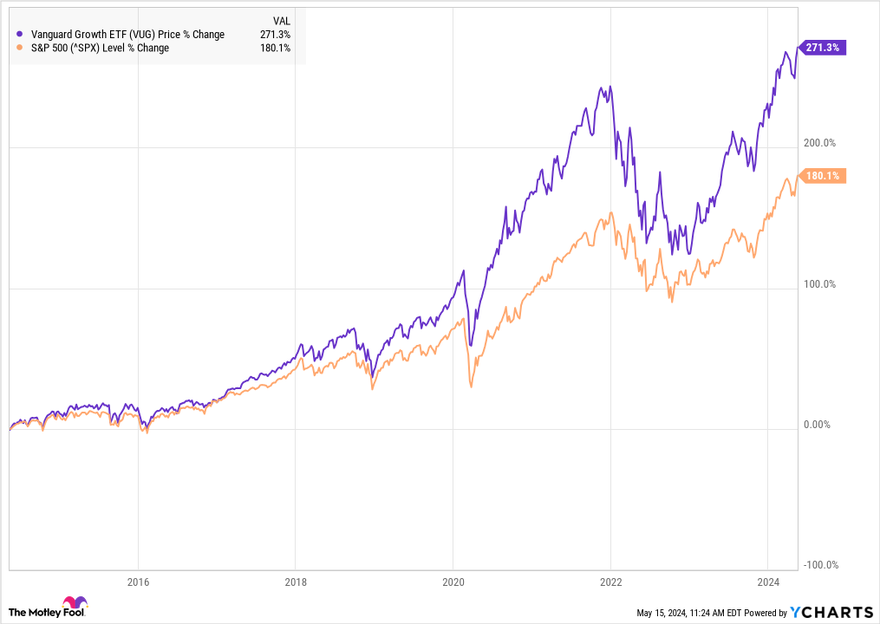
That said, if you’re a long‑term investor, a day‑to‑day price tick isn’t the whole story. It’s more useful to watch trends over weeks or months, compare the net asset value (NAV) to the market price, and keep an eye on the expense ratio.
Key Sources for Real‑Time Prices
Not all price feeds are created equal. Here are the most reliable places to check VUG’s current value:
- Vanguard’s official website: The fund’s page updates the intraday price and shows the NAV side‑by‑side.
- Major broker platforms: Think Fidelity, Charles Schwab, or Robinhood – they usually offer delayed quotes (15‑minute lag) for free, with real‑time data if you have a premium account.
- Financial news sites: Bloomberg, Reuters, and Yahoo Finance provide quick glance charts and historical data.
- Mobile apps: Apps like Seeking Alpha or Investing.com push notifications when VUG moves beyond a threshold you set.
How to Compare Market Price and NAV
Sometimes VUG trades at a premium (price above NAV) or a discount (price below NAV). Spotting this gap can signal short‑term arbitrage opportunities or hint at broader market stress. Follow these steps:
- Locate the latest NAV on Vanguard’s fund page – it’s updated at the end of each trading day.
- Check the live market price on your broker’s platform.
- Calculate the premium/discount: (Market Price – NAV) ÷ NAV × 100%.
- If the difference exceeds 0.5‑1%, investigate why: are there macro‑economic headlines, earnings reports, or sector rotation at play?
Tools for Monitoring Price Trends
Beyond raw numbers, visualizing the price helps you spot patterns. Consider adding these tools to your toolkit:
- Moving averages: A 20‑day and 50‑day SMA can smooth out daily volatility.
- Relative Strength Index (RSI): When the RSI tops 70, the ETF may be overbought; under 30 could indicate oversold conditions.
- Volume spikes: Sudden increases in trading volume often precede larger price moves.
Most charting platforms let you overlay these indicators with just a few clicks. Play around with the settings until the visual cues feel intuitive for your strategy.
Timing Your Checks: How Often Is Enough?
There’s a temptation to stare at the screen all day, but that rarely adds value for most investors. Here’s a sensible schedule:
- Morning glance (8‑10 AM ET): Spot the opening price, note any overnight news.
- Mid‑day review (12‑1 PM ET): Confirm whether the price has stuck to its trend or deviated sharply.
- End‑of‑day wrap (3‑4 PM ET): Compare the close to the NAV, log the premium/discount for reference.
If you’re trading more actively, you might add a quick post‑market check when earnings season rolls around, since growth stocks can react sharply to earnings surprises.
Common Pitfalls to Avoid
Even seasoned investors slip up now and then. Keep an eye out for these typical mistakes:
- Chasing the price: Reacting to every dip can erode returns, especially when the ETF’s underlying fundamentals remain strong.
- Ignoring expense ratio impact: VUG’s low fee is a key advantage; a sudden price dip doesn’t offset higher costs elsewhere.
- Over‑reliance on one source: Cross‑checking across at least two platforms reduces the risk of stale or erroneous data.
Putting It All Together: A Sample Routine
Imagine you’ve set aside a modest portfolio portion for growth exposure. Your daily routine might look like this:
- Open Vanguard’s page, note the NAV and any recent fund commentary.
- Switch to your broker’s chart, apply a 20‑day SMA and RSI.
- Log the premium/discount in a simple spreadsheet.
- If the price sits at a discount >0.8% and the RSI is under 35, consider a modest addition.
- Otherwise, stick to your long‑term plan and revisit the next day.
This approach balances vigilance with restraint, letting you act on genuine signals rather than hype.
Where to Look for Future Price Drivers
Growth ETFs are especially sensitive to a handful of macro trends:
- Interest‑rate outlook: Higher rates can dent growth valuations, pulling VUG’s price lower.
- Tech earnings season: Since many of VUG’s top holdings are tech‑heavy, earnings beats or misses ripple through the fund.
- Policy changes: Tax reforms or fiscal stimulus can shift investor appetite for growth versus value assets.
Staying aware of these broader forces helps you interpret price moves, rather than treating them as isolated events.