How to Use a Free Boom and Crash Spike Detector Indicator
If you’ve been trading the Boom or Crash assets on platforms like Deriv, you’ve probably noticed how quickly prices can jump from calm to chaotic. Those sudden spikes can either become a trader’s best friend or worst nightmare. Luckily, a spike‑detector indicator can shine a light on those flash moments—sometimes even before they happen. In this guide we’ll walk through what the tool does, how to get a free version, and practical steps to integrate it into your trading routine.
What Is a Spike Detector, Really?
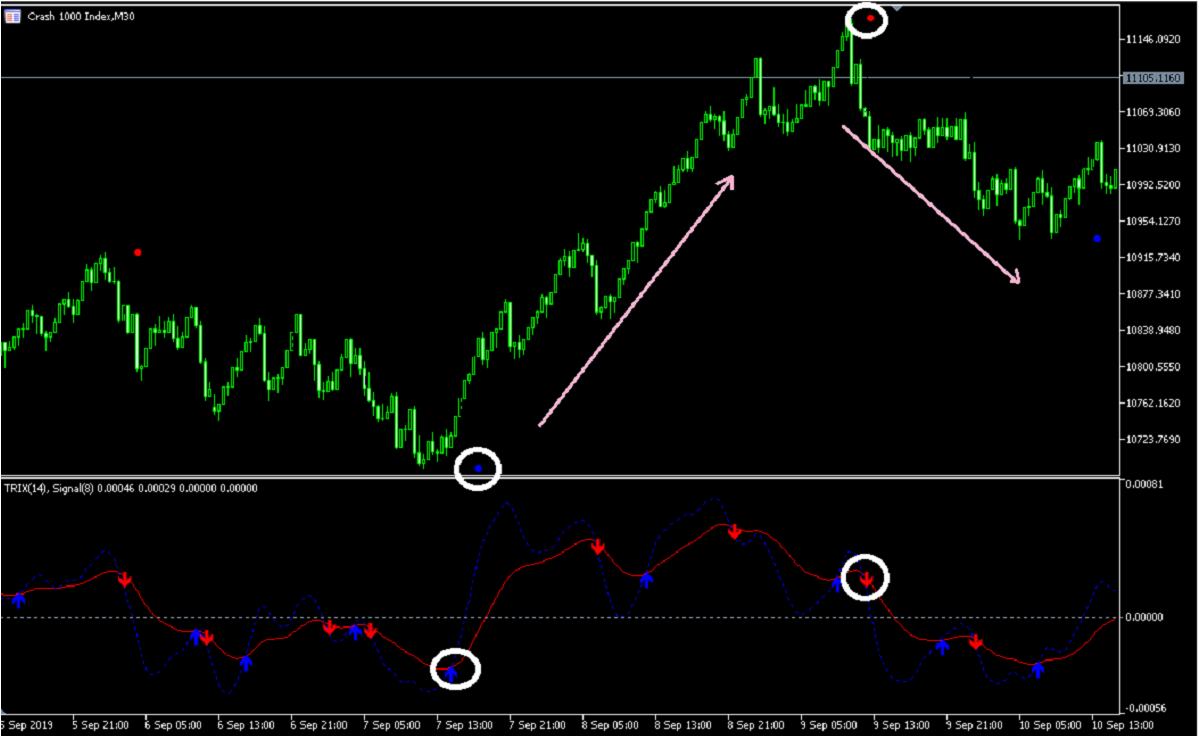
At its core, a spike detector is a script that monitors price‑movement velocity. When the algorithm senses a rapid change—often measured in ticks per second—it flags the bar with a visual cue, such as a colored line or a flashing icon. The idea isn’t to predict the future in a crystal‑ball way; it’s to highlight moments when the market is behaving unusually fast, giving you a chance to react.
Most free versions focus on two main metrics:
- Speed: how quickly the price moves within a short interval.
- Volume spikes: sudden surges in trade count that often accompany aggressive moves.
When both line up, the indicator draws attention—usually a bright red or orange bar—signaling a potential “spike” zone.
Where to Find a Free Download
There are several community‑driven sites that host free Boom and Crash spike detectors, often as MetaTrader 4/5 or Deriv’s own DTrader scripts. A quick search will point you to places like:
- GitHub repositories where developers share their .ex4 or .mq5 files.
- Deriv’s forum threads, where users exchange .js indicators for the WebTrader.
- Trading‑education blogs that bundle the script with a short tutorial.
Before you click “download,” verify a few things: the file type matches your platform, the author has a modest reputation score, and the description mentions no hidden fees. A quick glance at the code (or a comment from another trader) can also reveal whether the script is safe and up‑to‑date.
Installing the Indicator
MetaTrader 4/5
1. Open the Data Folder from the platform’s File menu.
2. Drag the .ex4/.mq5 file into the MQL4/Indicators (or MQL5/Indicators) folder.
3. Restart the platform.
4. Find the new indicator in the Navigator panel, drag it onto a Boom or Crash chart, and enable the visual alerts.
Deriv WebTrader
1. Log into your account and click “Chart.”
2. Select “Indicators” → “Custom.”
3. Upload the .js file you downloaded.
4. Adjust the sensitivity sliders to suit your risk tolerance, then hit “Apply.”
Fine‑Tuning Sensitivity: One Size Doesn’t Fit All
Most free detectors ship with default settings that work okay for a 1‑minute chart, but if you trade on a 5‑second frame, those defaults will flag almost every tick. Here’s a quick cheat sheet:
- Low sensitivity: fewer false alarms, but you might miss early spikes.
- High sensitivity: catches almost every rapid move, at the cost of more noise.
- Mid‑range (recommended): a balanced approach for most traders on 1‑minute charts.
Adjust the threshold value until you see roughly one or two alerts per hour during active market periods. That’s usually a sweet spot.
Using the Alerts Effectively
Seeing a red bar is only half the battle; you need a plan for what to do next. Consider these tactics:
- Confirm with another tool: pair the spike detector with a momentum oscillator (e.g., RSI) to gauge whether the price is overbought or oversold.
- Set tight stop‑losses: spikes can reverse as fast as they appear. A 5‑pip stop can protect you from a sudden reversal.
- Watch the order book: on platforms that show depth, a spike often coincides with a wall of orders being cleared.
In practice, many traders wait for the spike to finish, then look for a candle close in the direction of the move before entering.
Common Pitfalls to Avoid
Even a free indicator can become a liability if misused. Here are a few traps to watch out for:
- Over‑reliance: Treat the detector as a hint, not a guarantee.
- Ignoring market context: A spike during a low‑volume window may be meaningless.
- Setting alerts too tight: You’ll hear the alarm every few seconds, making it hard to act decisively.
Balancing the tool with your overall strategy keeps it from turning into background noise.
Does a Free Version Really Hold Up?
In the wild, free indicators vary. Some are just a re‑skinned version of a basic moving‑average crossover, while others are genuine, rigorously tested scripts. The best way to judge is to back‑test. Load historical Boom or Crash data, apply the indicator, and note how often the flagged spikes led to a profitable move. If you see a decent win‑rate—say 55‑60%—the free tool is doing its job.
Wrapping Up the Essentials
Getting a free Boom and Crash spike detector isn’t a magic ticket, but it can shave seconds off your reaction time, which matters in a market that moves in the blink of an eye. Download from a reputable source, install it on the right platform, tweak the sensitivity, and pair the alerts with a solid risk plan. When you treat the indicator as a supplemental eye rather than a crystal ball, it becomes a practical ally in a fast‑paced trading environment.