How WebRTC Wizards Reveal Real‑Time Connection Insights
When you first hear “WebRTC,” the mind jumps to video chats, voice calls, and the promise of peer‑to‑peer magic. Yet beneath that sleek surface lies a flood of data about latency, packet loss, and bandwidth that can make or break an app’s user experience. WebRTC Wizards steps in as a sort of detective, turning raw metrics into stories you can actually act on.
What Is WebRTC and Why It Matters
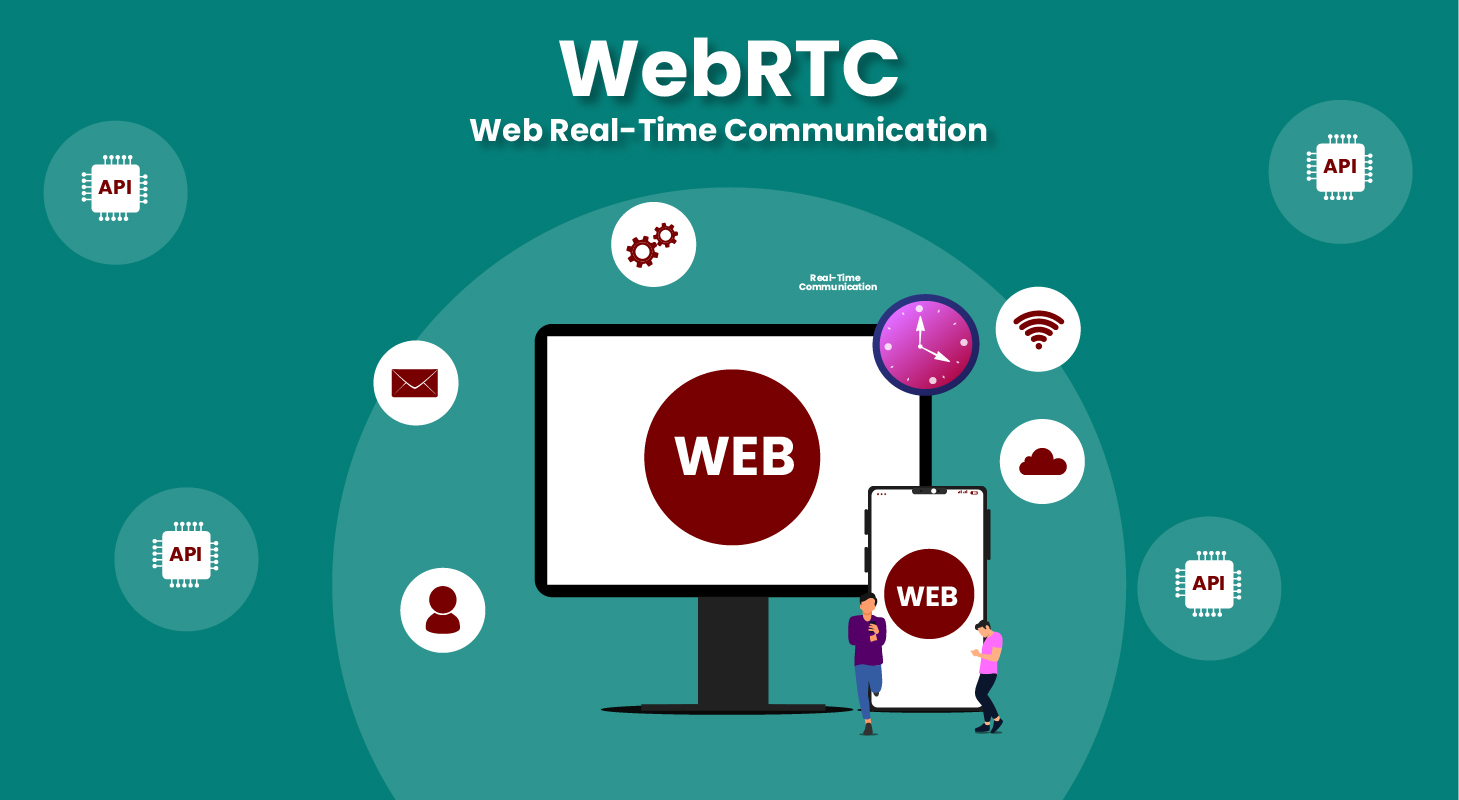
At its core, WebRTC (Web Real‑Time Communication) is a set of browser APIs that let two browsers talk directly, without a server in the middle. This eliminates the need for plugins and reduces round‑trip time dramatically. The result? Faster video, smoother audio, and the occasional surprise when a connection drops.
Developers love it for the flexibility, but the real challenge is monitoring. A few milliseconds of jitter can mute a speaker’s voice, while an unnoticed bandwidth dip may pixelate a video stream. That’s where insight tools become indispensable.
Inside WebRTC Wizards – Core Features
Real‑Time Connection Dashboard
The dashboard feels like a cockpit for your media streams. It aggregates key indicators—RTT, ICE candidate pairs, and SDP negotiations—into a single view that updates every second. Colours shift subtly: green for stable, amber for caution, red for trouble.
What’s nice is the ability to pause and replay a session, letting you chase down that fleeting glitch you just missed during a live call.
Latency & Bandwidth Analytics
Beyond the surface numbers, WebRTC Wizards breaks down latency by direction (send vs. receive) and pins the exact network hop causing delays. Bandwidth graphs show both the maximum achievable throughput and the real‑world consumption, helping you spot when a browser caps data to save battery.
The tool also flags abnormal spikes—say, a sudden 300 % increase in packet loss—so you can correlate it with user reports or server logs.
Getting the Most Out of the Insights
- Set realistic thresholds. Not every millisecond of delay matters; define the range that truly impacts your UI.
- Correlate with user metrics. Pair connection stats with engagement data to see if a jitter spike actually leads to churn.
- Use the heatmap view to spot geographic patterns—perhaps a certain ISP is consistently slower.
- Schedule automated alerts for critical events; a sudden rise in jitter > 50 ms could trigger a fallback to lower‑resolution video.
- Export raw JSON logs when you need deeper forensic analysis or to feed a machine‑learning model.
Common Pitfalls and How to Avoid Them
Even the best tools can mislead if you’re not careful.
- Over‑reliance on averages. A mean RTT of 80 ms hides occasional 300 ms outliers that users notice.
- Ignoring ICE restarts. When the network changes, the connection renegotiates; failing to track those events masks real performance shifts.
- Treating every packet loss as a failure. Small, transient loss is normal; focus on sustained patterns.
- Skipping browser‑specific quirks. Chrome, Firefox, and Safari each expose slightly different stats—compare apples to apples.
Future Trends in Real‑Time Communication
WebRTC continues to evolve. The upcoming ORTC extensions promise finer‑grained control over codecs, while edge‑computing nodes aim to push processing closer to the user, shaving off more latency. Expect dashboards like WebRTC Wizards to incorporate AI‑driven anomaly detection, automatically suggesting remedial actions before you even notice a problem.
In the meantime, the principle stays the same: turn raw connection data into clear, actionable insight, and let your users enjoy a seamless, real‑time experience.