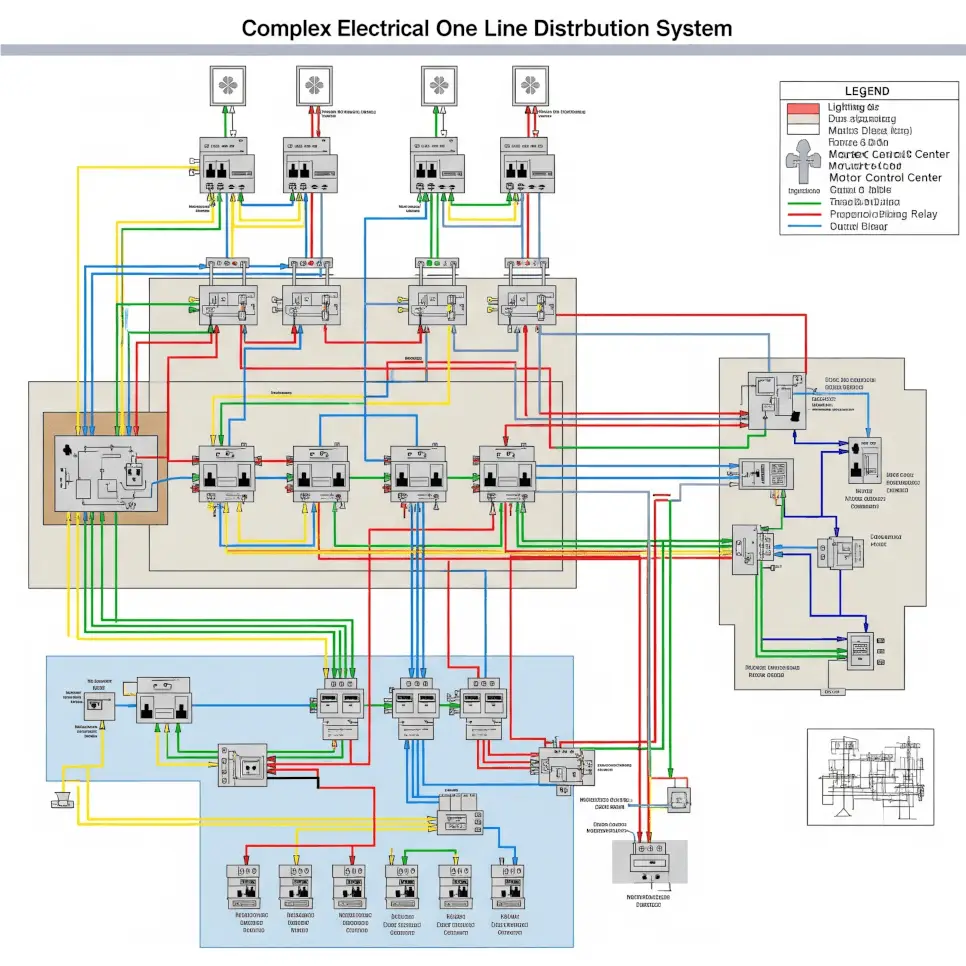
Single Line Diagram Simplified Guide
If you have ever stared at a complex electrical schematic and felt your eyes glaze over, you are not alone. Electrical drawings can look like abstract art created by a caffeinated engineer. But there is a simpler way to visualize power systems: the single line diagram (SLD). These diagrams strip away the clutter of three-phase wiring to give you a clear, concise map of how electricity flows through a facility.
Whether you are an electrical engineering student, a facility manager, or a curious homeowner trying to understand your panel board, grasping the basics of an SLD is a superpower. It transforms a maze of wires into a logical flowchart. This guide breaks down what these diagrams are, why they matter, and how to read them without needing a degree in power systems.
What Is a Single Line Diagram?
At its core, a single line diagram is a symbolic representation of an electrical power system. Instead of drawing every single wire for all three phases (A, B, and C), the diagram uses a single line to represent all three. This simplification is crucial because, in balanced power systems, all three phases are identical in magnitude and separated by 120 degrees. Drawing them all would be redundant and visually chaotic.
Think of it like a subway map. You don’t need to see every rail, every bolt, or the exact curvature of the tracks to know how to get from Union Station to Central Park. You just need to know the lines, the stops, and the connections. An SLD does the exact same thing for electricity. It shows the source, the protection devices, the distribution paths, and the loads.
These diagrams are the backbone of electrical design. They are used in power plants, substations, commercial buildings, and industrial facilities. Without them, coordinating the installation, maintenance, and troubleshooting of electrical systems would be nearly impossible.
Why Use Single Line Instead of Three-Line?
You might wonder why we don’t just draw everything out fully. A three-line diagram shows each phase individually. While this is necessary for detailed wiring instructions or analyzing unbalanced faults, it is terrible for big-picture planning.
Imagine trying to understand the highway system of a country by looking at a map that draws every single lane of every road. It would take pages just to show one city. Single line diagrams provide clarity at a distance. They allow engineers to quickly assess:
- The overall topology of the power system.
- The rating and type of major equipment.
- The direction of power flow.
- The protective coordination scheme.
When it comes to troubleshooting outages or planning expansions, the SLD is the first document any electrician or engineer will pull up. It saves time and reduces the risk of misinterpretation.
Key Symbols and Components You Need to Know
Reading an SLD is like learning a new alphabet. Once you recognize the basic symbols, the diagram starts to make sense. Here are the most common elements you will encounter.
Power Sources
Every diagram starts with energy. This could be the utility grid, represented by a circle or a transformer symbol, or an on-site generator. You will often see circles with letters inside indicating the phase rotation or specific generator sets.
Transformers
Transformers change voltage levels. In an SLD, they are usually depicted as two overlapping circles. One side represents the high voltage (primary), and the other represents the low voltage (secondary) side. They are critical for stepping voltage down from incoming utility lines to safe levels for building usage.
Circuit Breakers and Switches
These are the safety valves of the electrical system. A square with a diagonal line through it typically represents a circuit breaker. Switches are shown as open or closed lines, indicating manual control points. These devices protect the equipment from overloads and short circuits.
Buses and Busbars
Conductors are drawn as solid lines. Where multiple circuits connect, you will see a busbar, often represented by a thick horizontal or vertical line. This is the central distribution hub where power is split off to various feeders.
Loads
Loads are the equipment consuming the power. Motors might be shown as circles with an 'M' inside. Lighting and general power loads are often grouped into a single rectangular block labeled with the total horsepower or kilowatt rating. Outlines of buildings or floor plans may also be included to show physical layout context.
How Power Flows Through the Diagram
Once you identify the components, the next step is to trace the flow. Standard convention usually places the power source on the left or the top, with loads on the right or bottom. This is known as a left-to-right or top-to-bottom flow.
Start at the utility entrance. Follow the line through the main transformer, noting the voltage change. Move to the main breaker, which protects the entire system. From there, branch out to the individual feeders. Each branch represents a different area or piece of equipment. By tracing this path, you can isolate where a failure might be occurring or where additional capacity is needed.
Pay close attention to the notes and schedules attached to the diagram. These often contain critical data like cable sizes, fuse ratings, and generator specifications that aren’t drawn directly on the schematic lines.
Common Mistakes to Avoid
Even experienced professionals can misread an SLD. One common error is assuming that a single line means only one wire exists. Remember, it represents the entire three-phase system. Another mistake is ignoring the hidden details. Small annotations might indicate double-ended breakers, automatic transfer switches, or specific grounding methods. If a component looks ambiguous, cross-reference it with the legend provided at the bottom or side of the document.
FAQ
Q: Can I use a single line diagram for residential wiring?
A: While residential electricians often use more detailed schematics for debugging, simple single line diagrams are very useful for designing home panels and documenting service upgrades. It helps visualize the main breaker and sub-panels clearly.
Q: How often should an SLD be updated?
A: Best practice dictates updating the SLD after any significant change to the electrical system, such as adding a new generator, replacing transformers, or adding major loads. It should remain a "living document" that reflects the current state of the facility.
Q: What software is used to create these diagrams?
A: Professional engineers often use specialized tools like ETAP, SKM PowerTools, or AutoCAD Electrical. However, simpler diagrams can be created in standard drafting software or even PowerPoint for basic presentations.