What Sets Industry P/E Apart From P/E TTM? Key Differences Explained
Understanding the Basics
When you glance at a stock screen, you’ll often see two ratios that look almost identical: the industry price‑to‑earnings (P/E) multiple and the P/E TTM (trailing‑twelve‑months). Both attempt to tell you how much investors are paying for a dollar of earnings, yet they arrive at that number in subtly different ways.
Industry P/E: A Peer‑Group Perspective
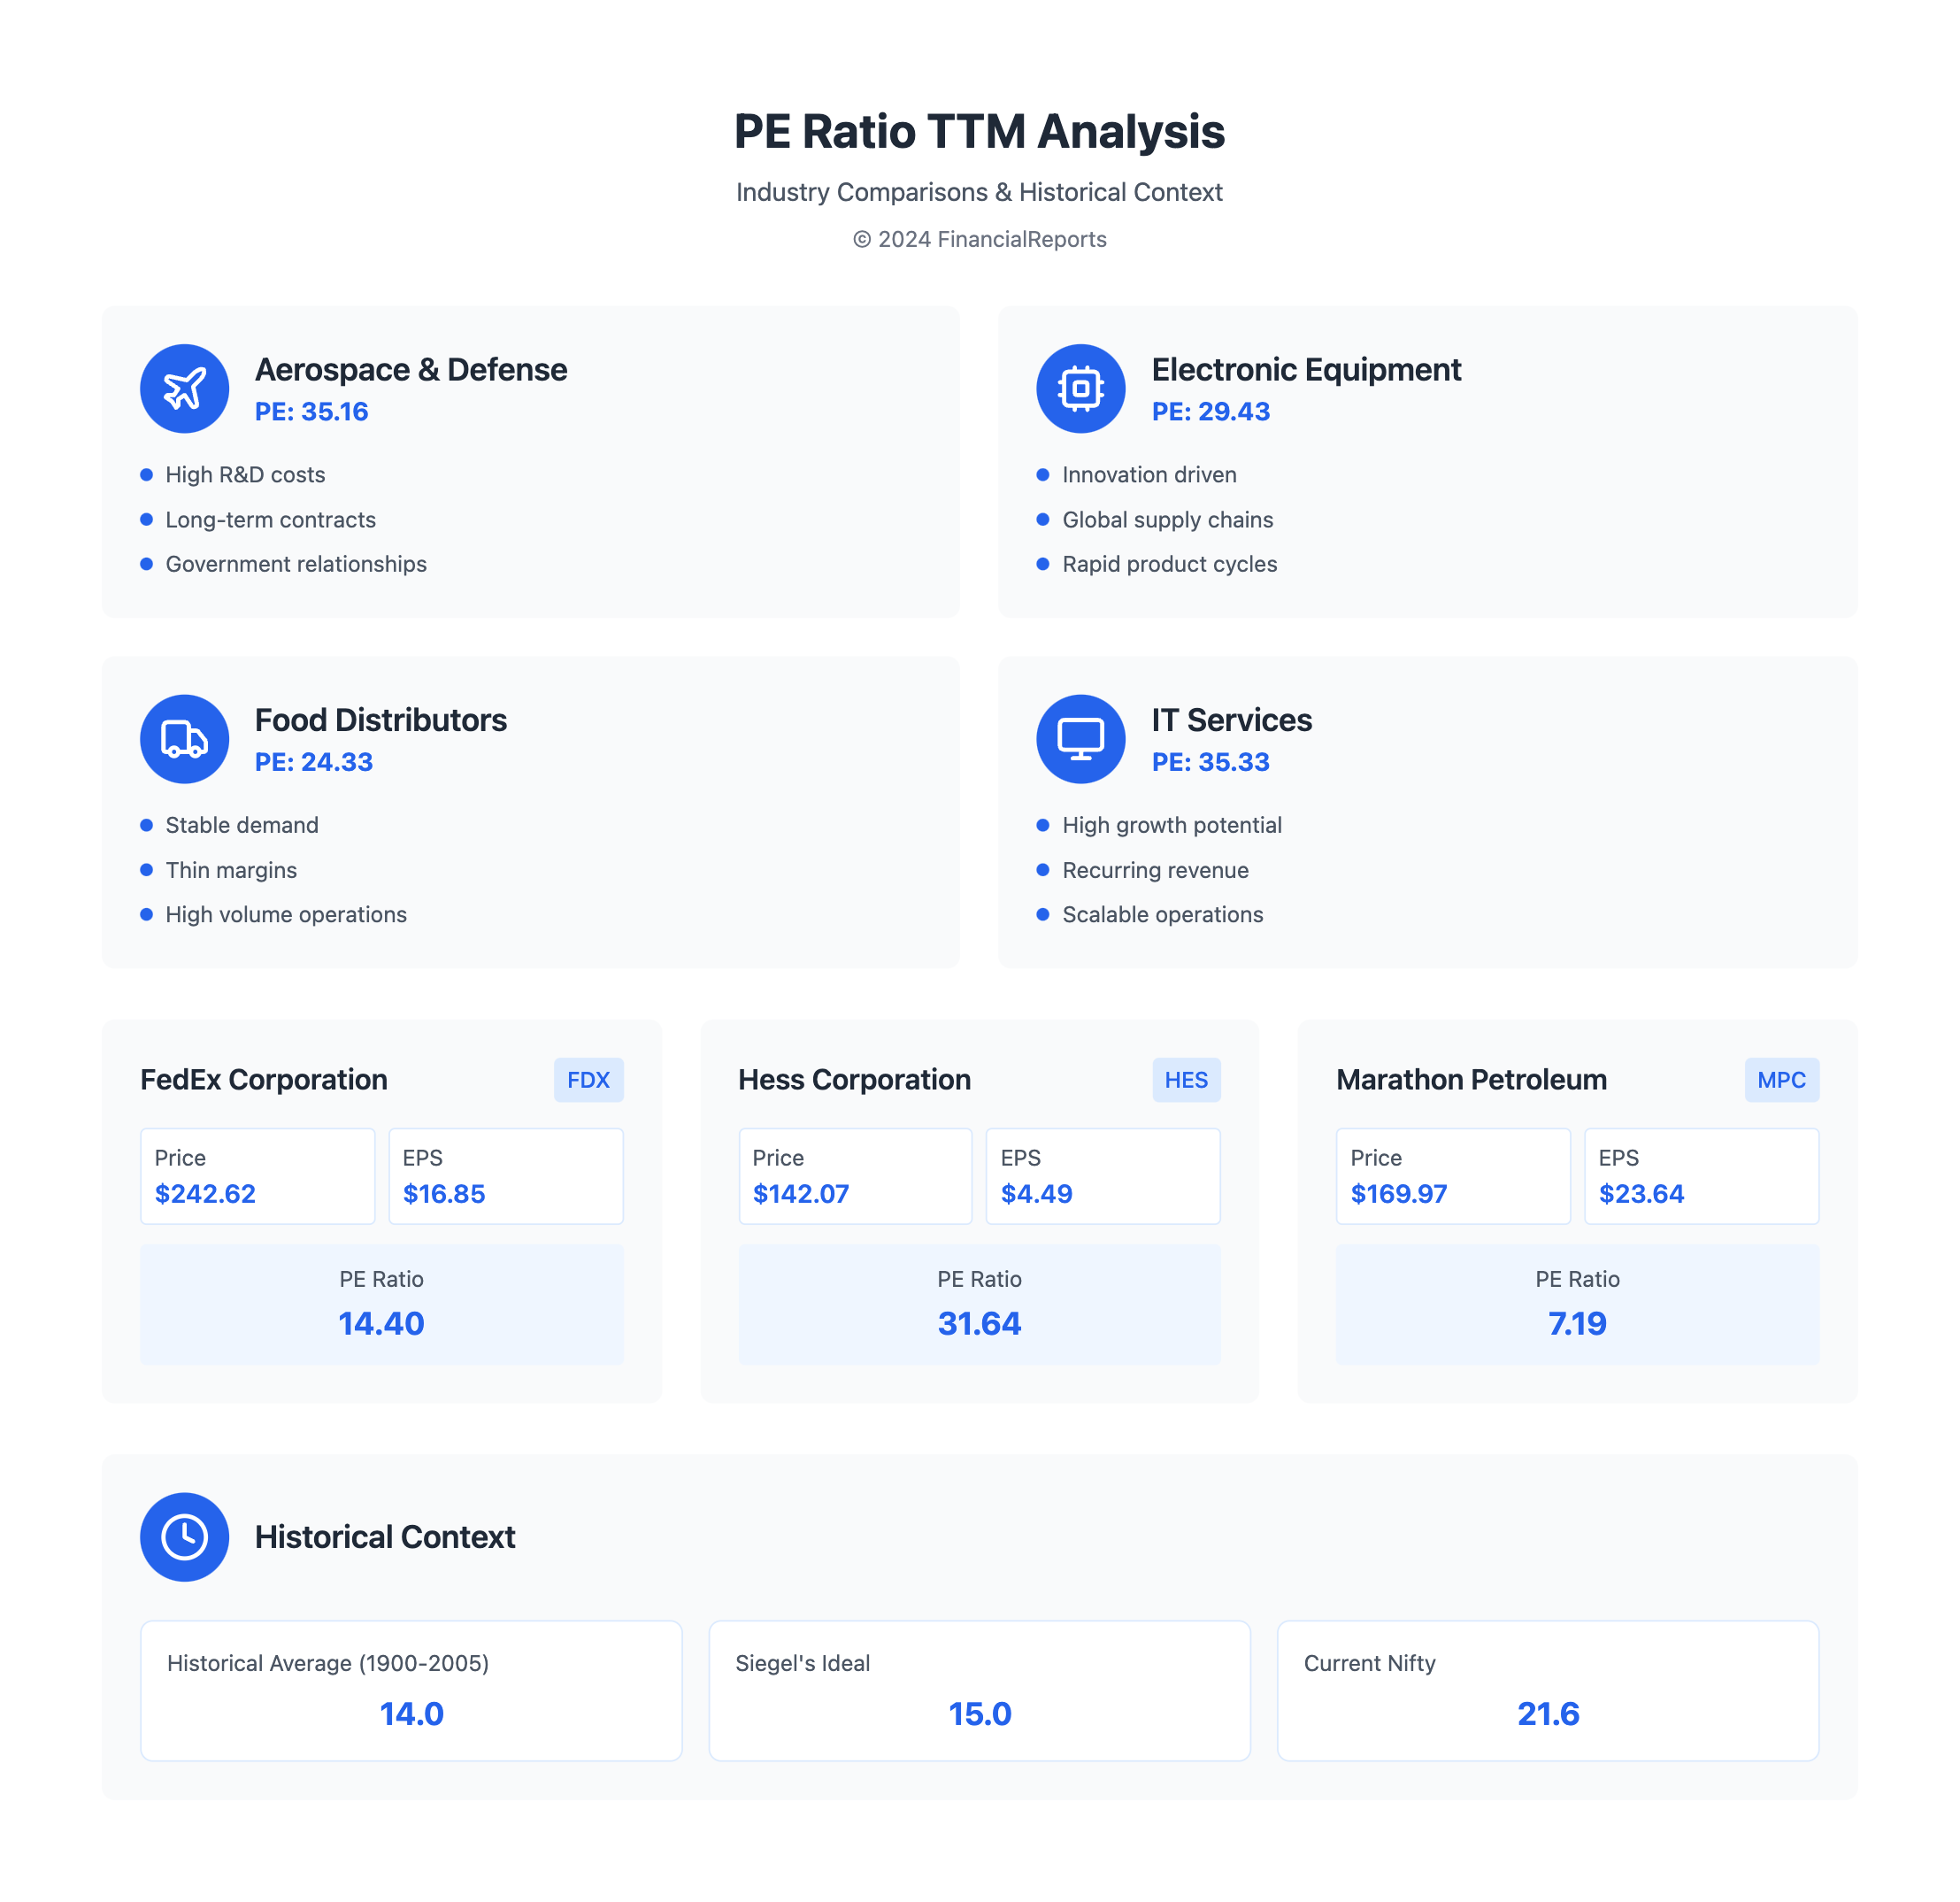
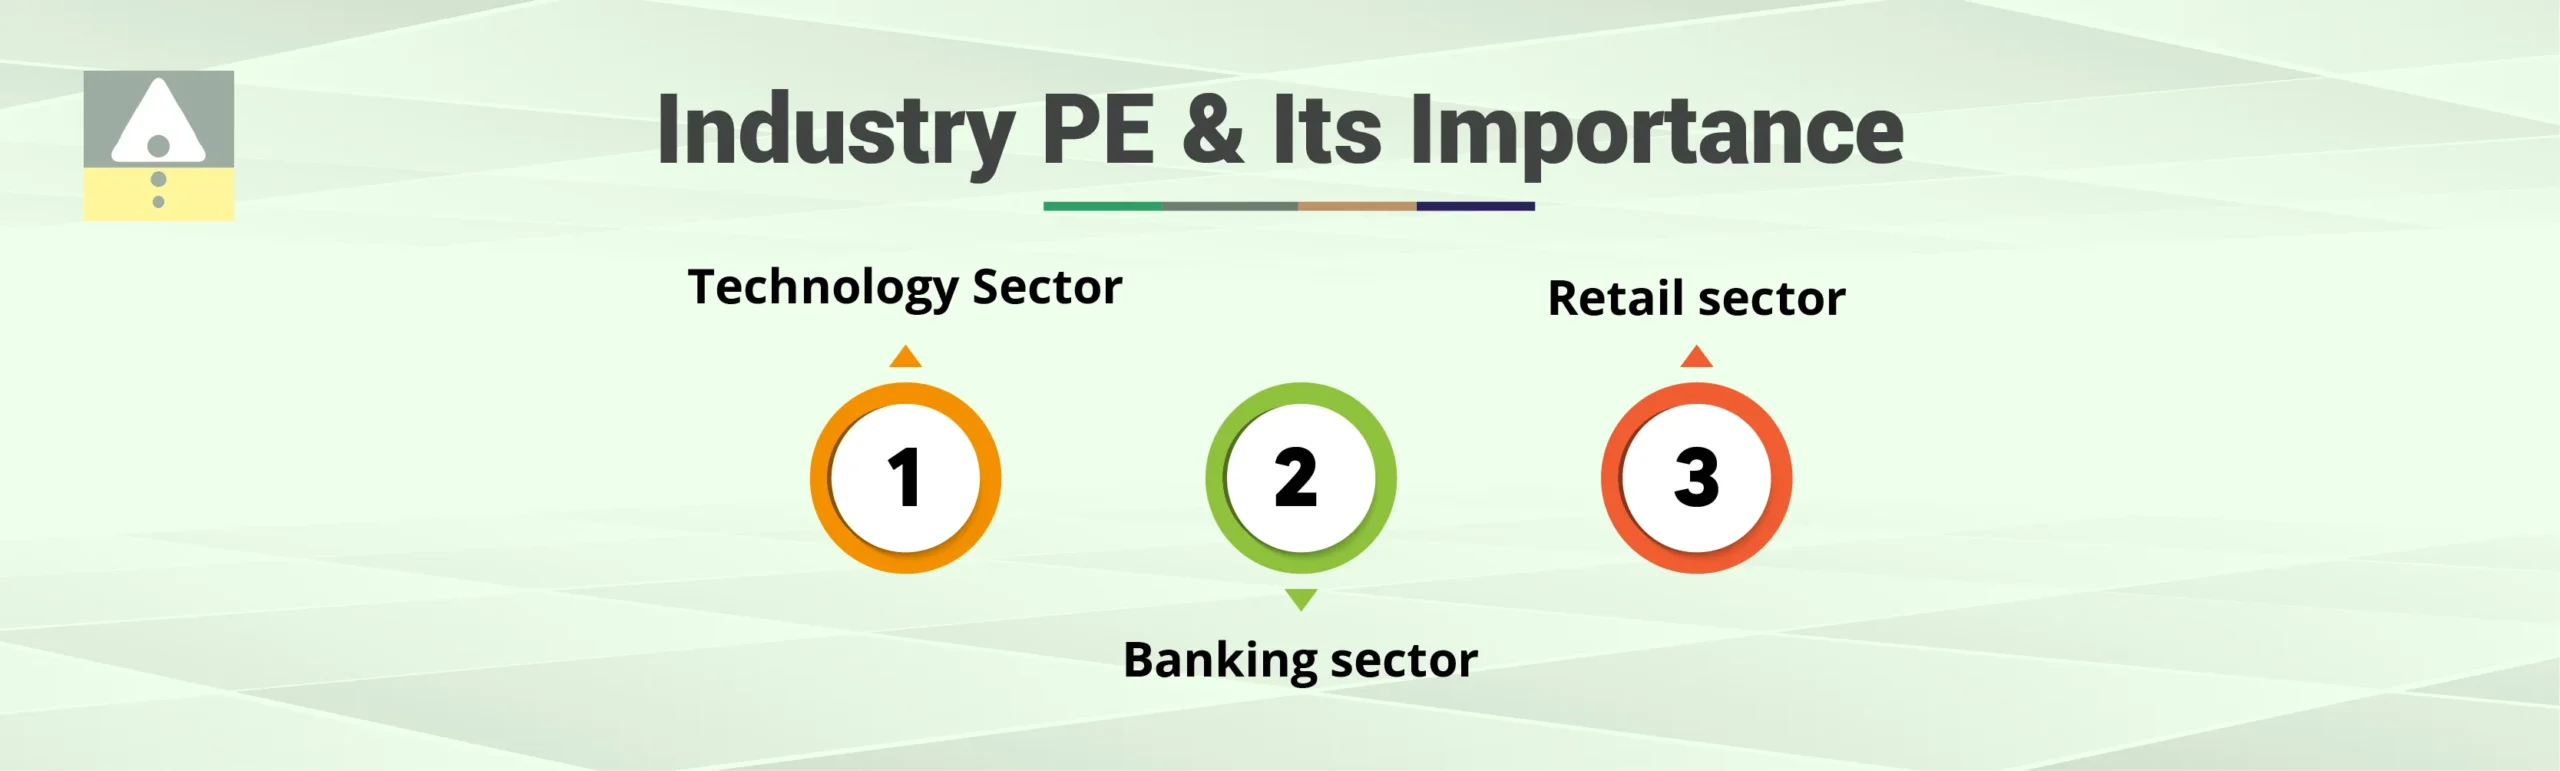
The industry P/E is calculated by taking the average (or sometimes median) P/E of all publicly traded companies classified in the same sector. Think of it as the “neighbourhood standard” – a benchmark that says, “In this line of business, companies typically trade at X times earnings.”
- Data source: Earnings figures are usually taken from the most recent fiscal year or the latest consensus estimates.
- Purpose: It helps you judge whether a stock is cheap or pricey relative to its peers, regardless of its own earnings history.
- Volatility: Because you’re averaging many firms, the number smooths out the wild swings you might see in a single company’s earnings.
P/E TTM: The Company‑Specific Lens
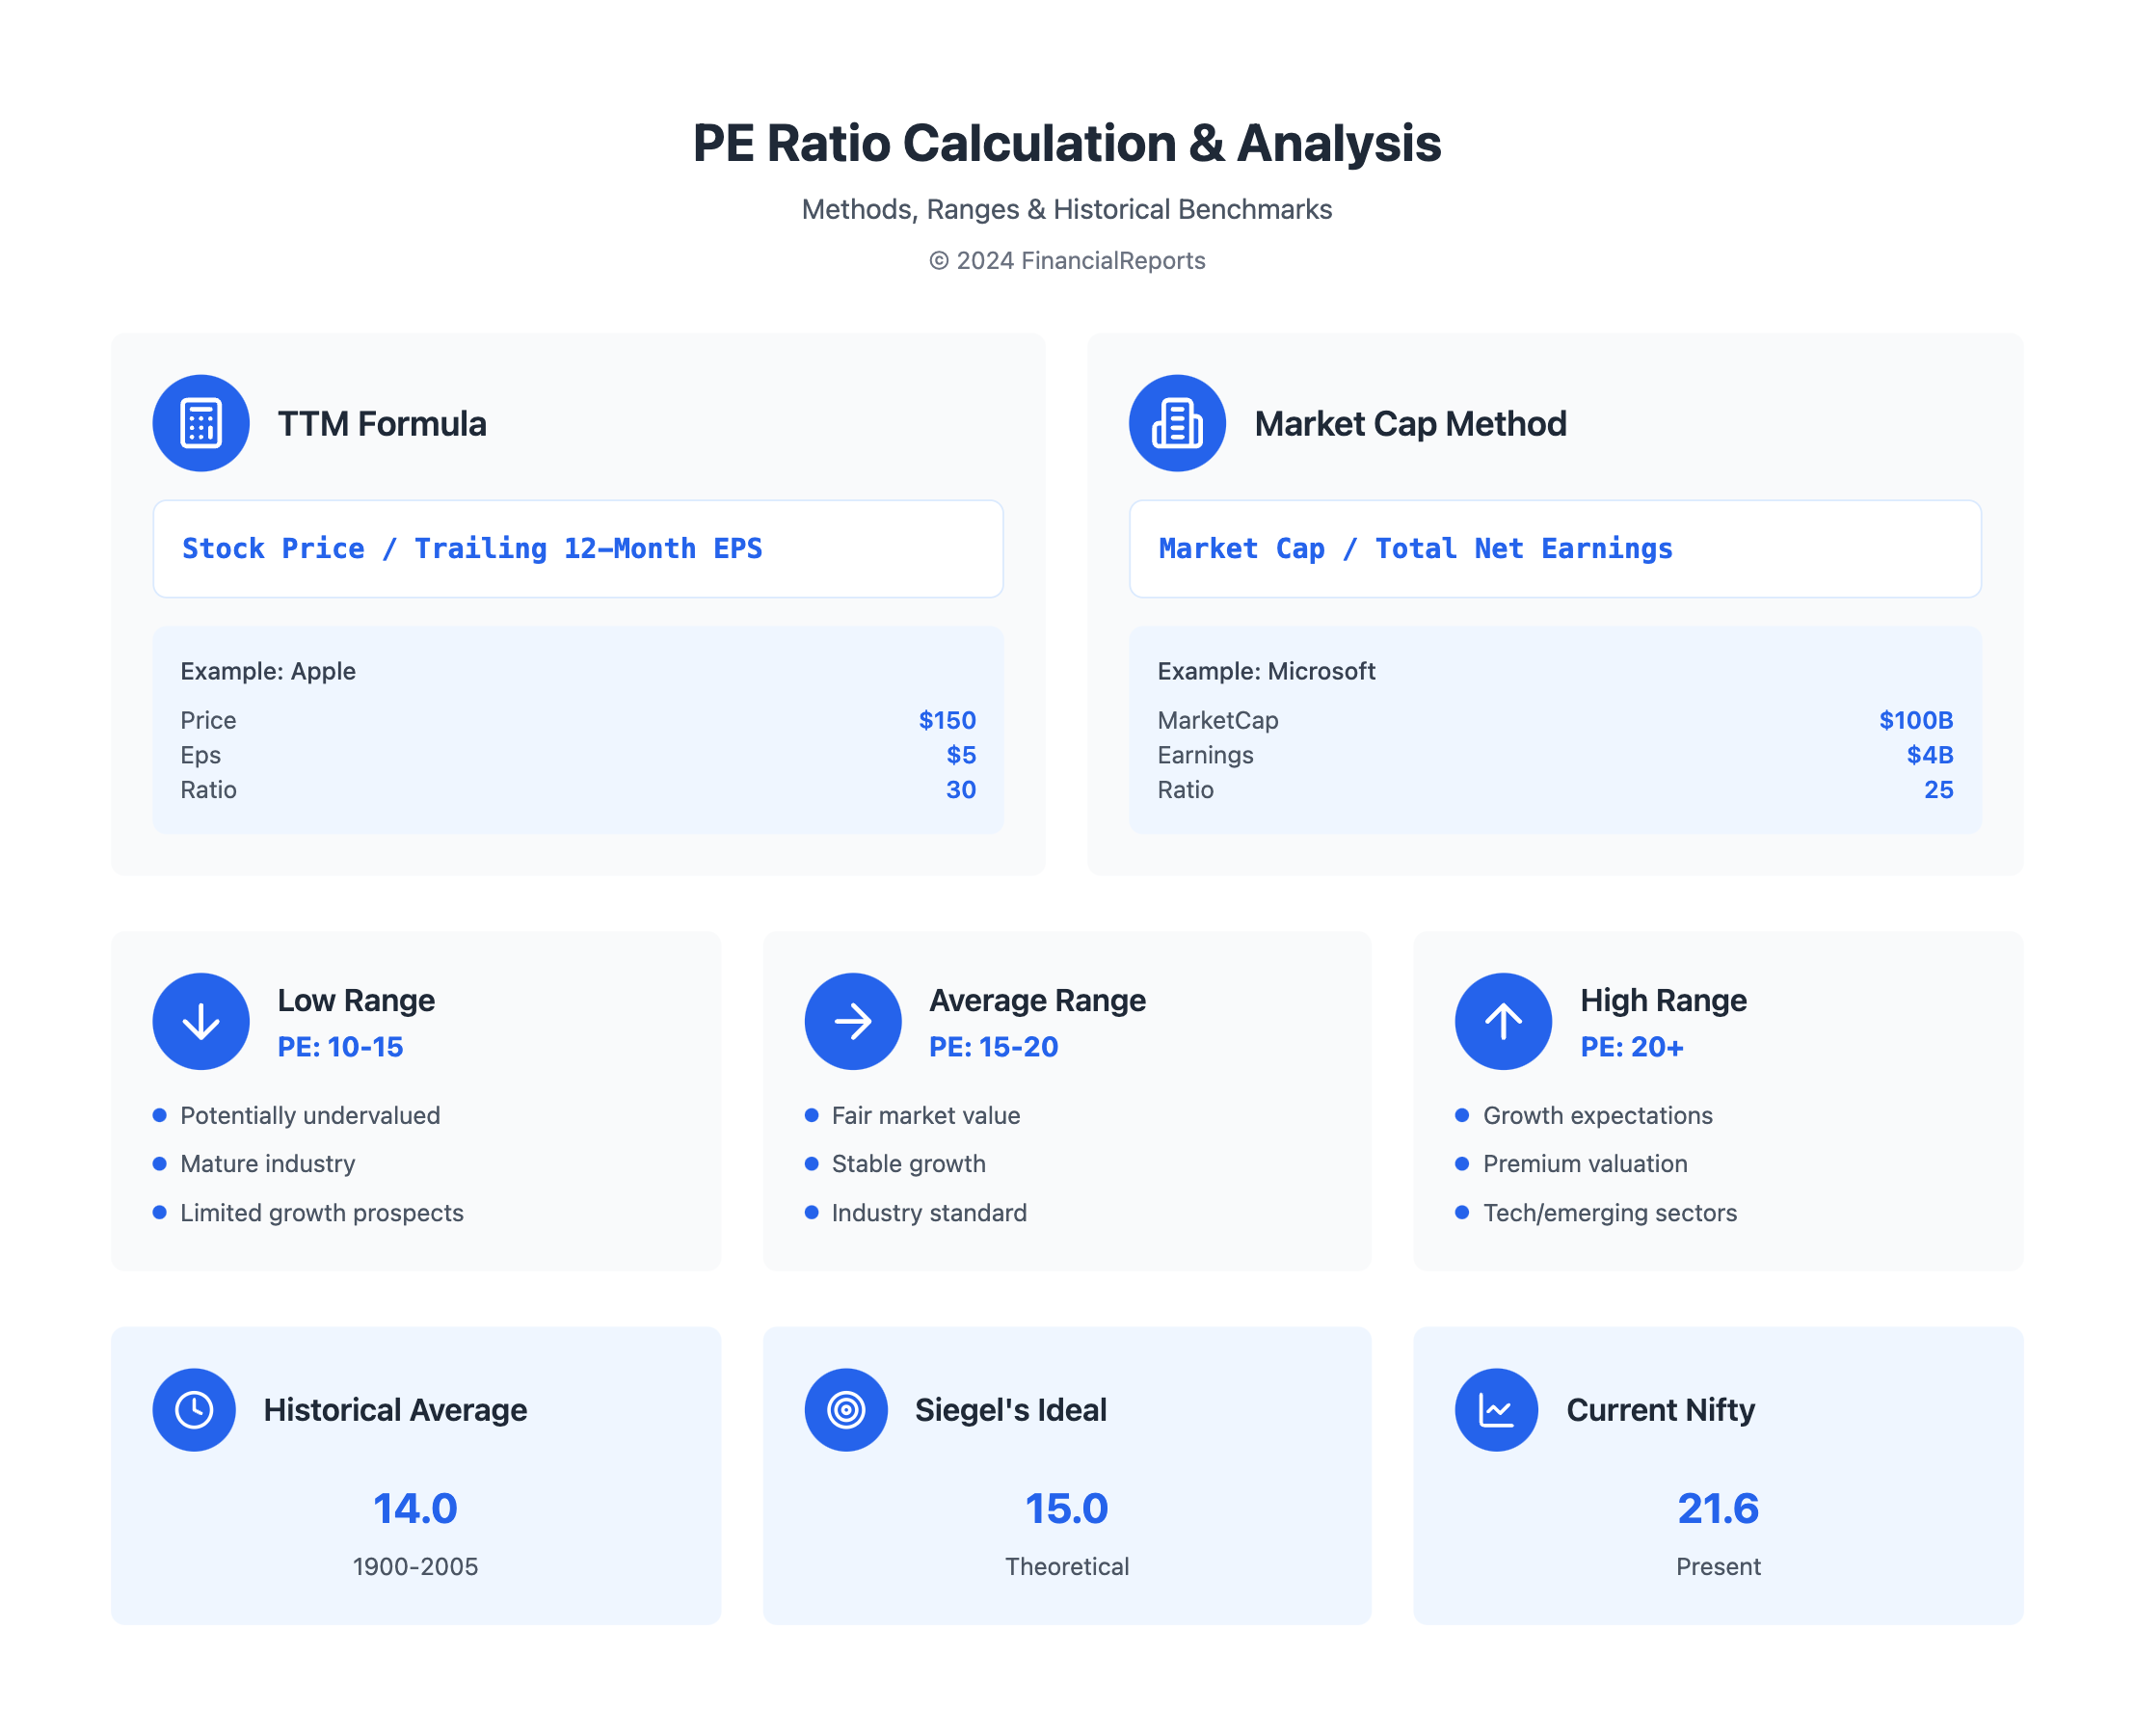
By contrast, the P/E TTM looks solely at a single company’s last twelve months of actual earnings. It’s a pure, after‑the‑fact measurement: price divided by earnings that have already been reported.
- Time frame: The “trailing twelve months” window slides forward each day, always reflecting the most recent four quarters.
- Accuracy: Since it uses real earnings rather than forecasts, it’s less prone to analyst bias.
- Sensitivity: A one‑off profit spike or a temporary loss can dramatically swing the ratio.
Why the Two Numbers Can Diverge
It’s easy to assume the two ratios should line up, but several forces push them apart:
- Growth expectations: A fast‑growing firm often trades at a higher P/E TTM than the industry average, even if its current earnings are modest.
- Cyclical earnings: Companies in commodity‑heavy sectors may see earnings dip sharply one quarter, inflating their P/E TTM while the industry P/E remains steadier.
- Accounting choices: One firm might include one‑time gains in its earnings, lowering its P/E TTM, whereas the industry's aggregate smooths those anomalies.
When to Lean on Industry P/E
If you’re scouting for relative value—say, deciding whether a tech stock is overvalued compared to its rivals—the industry benchmark is a handy shortcut. It also mitigates the risk of chasing a temporary earnings bump that could evaporate next quarter.
When P/E TTM Matters More
Investors focused on cash‑flow generation, dividend sustainability, or short‑term price targets will gravitate toward the P/E TTM. It tells you exactly what the market has paid for the earnings already on the books, making it a reliable input for immediate valuation models.
Combining Both Views for a Balanced Take
Relying on a single metric is rarely wise. A practical approach is to:
- Check the P/E TTM to gauge current pricing relative to actual earnings.
- Contrast it with the industry P/E to see if the stock is a bargain or premium within its sector.
- Look at recent earnings trends—are they accelerating, flat, or declining?
This three‑pronged snapshot can reveal whether a high P/E TTM reflects genuine growth prospects or simply an over‑optimistic market bubble.
Common Pitfalls to Avoid
Even seasoned analysts trip up sometimes. Here are a few traps worth noting:
- Ignoring fiscal‑year differences: Some companies report on a calendar year, others on July‑June. Align the periods before you compare numbers.
- Over‑weighting a single outlier: A mega‑cap firm with a sky‑high P/E can skew the industry average. Median values can be more telling.
- Forgetting forward‑looking multiples: While P/E TTM is backward‑looking, many investors also track forward P/E (based on earnings estimates) for a fuller picture.
Bottom Line
The industry P/E gives you the context of a peer group, smoothing out the noise that often clouds a single firm’s numbers. The P/E TTM, meanwhile, offers a crystal‑clear view of what investors have actually paid for the past year’s earnings. Knowing when to trust each—and when to blend them—can sharpen your valuation toolkit and keep you from mistaking a temporary flare for a lasting trend.