How to Evaluate Food Stock Group Performance
When you look at a basket of food‑related equities, it’s tempting to focus on the headline numbers—revenue growth, profit margins, maybe even the latest earnings surprise. Yet the real story often lies in how the companies interact as a group. Understanding group performance gives you a clearer picture of risk, sector trends, and the underlying drivers that can boost—or drag—a portfolio of food stocks.
Why Group Analysis Matters
Individual metrics are useful, but they can be misleading when taken out of context. A single company might post impressive sales, but if its peers are struggling with raw‑material costs, the broader sector could be under pressure. Conversely, a modestly performing company could benefit from a sector‑wide supercycle, such as rising demand for plant‑based proteins.
Key reasons to assess the group as a whole include:
- Risk mitigation: Spotting sector‑wide headwinds before they erode your holdings.
- Trend identification: Recognizing emerging consumer preferences that affect multiple players.
- Relative valuation: Finding undervalued stocks by comparing them against peers.
Step 1: Define Your Peer Set
Not every food‑related company belongs in the same analytical lane. Start by grouping stocks that share a core business model or market focus. Common categories are:
- Packaged food producers (e.g., snack and ready‑meal manufacturers).
- Fresh produce growers and distributors.
- Ingredient suppliers, such as sugar, cocoa, or plant‑based protein firms.
- Food service operators, including restaurant chains and catering services.
Once you’ve isolated the relevant peers, verify that they trade on comparable exchanges and have similar reporting cycles. This ensures the data you compare is on a like‑for‑like basis.
Step 2: Gather Core Metrics
For each company, pull the following figures from the most recent quarterly or annual reports:
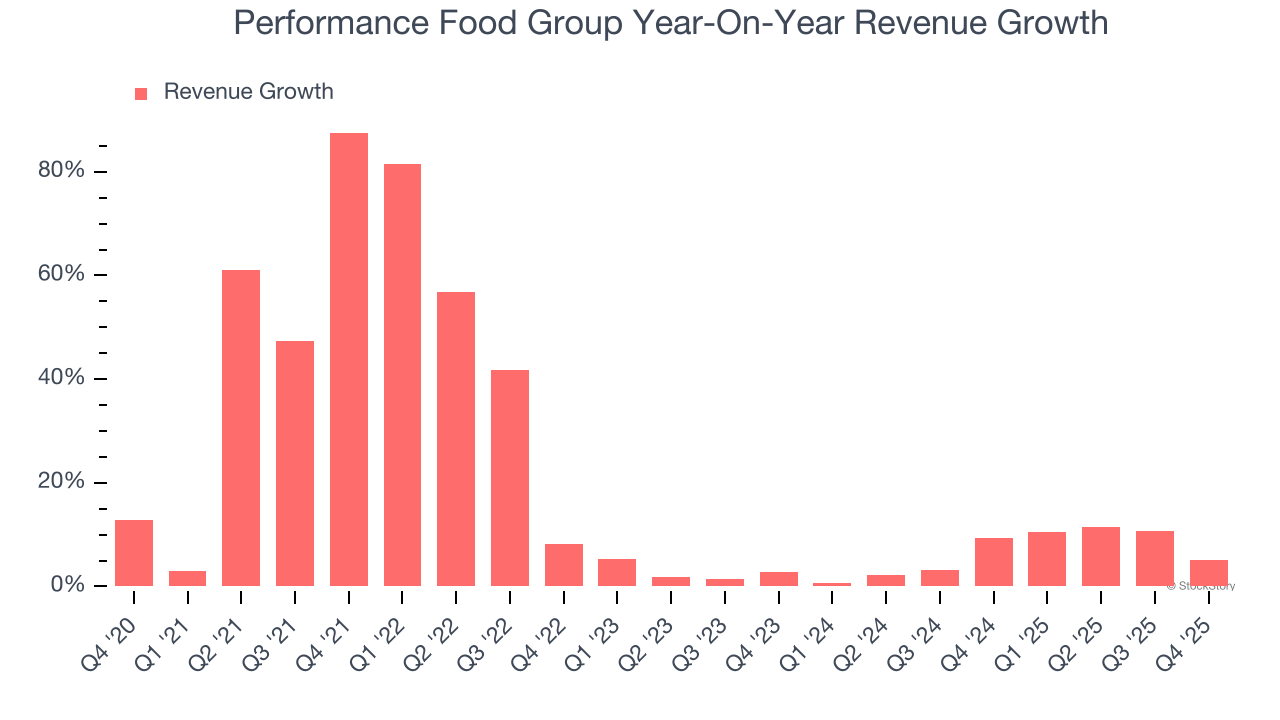
- Revenue growth (year‑over‑year and quarter‑over‑quarter).
- EBITDA margin.
- Free cash flow conversion.
- Debt‑to‑equity ratio.
- Return on invested capital (ROIC).
Running a quick spreadsheet that lines up these numbers side‑by‑side makes patterns immediately visible. You’ll often see that a handful of outliers are responsible for most of the sector’s volatility.
Step 3: Look Beyond the Numbers
Quantitative data tells only part of the story. Qualitative factors can shift a group’s outlook dramatically:
Supply‑Chain Dynamics
Food companies are uniquely sensitive to commodity prices, logistics bottlenecks, and seasonal weather events. A sudden spike in grain costs, for instance, hurts both packaged‑food makers and ingredient suppliers. Tracking commodity indices and freight rates can therefore add context to earnings surprises.
Regulatory Landscape
New labeling laws or safety standards can create compliance costs—or open opportunities for innovators. Keep an eye on government announcements, especially those involving nutrition guidelines or sustainability reporting.
Consumer Sentiment
Surveys on diet trends, sustainability concerns, and brand loyalty are gold mines for anticipating which sub‑segments will outperform. Social‑media sentiment analysis, while not perfect, often flags shifts before they appear in sales figures.
Step 4: Benchmark Against a Composite Index
Creating a simple equal‑weight index of your peer set provides a baseline for performance comparison. Plot the index’s total return alongside major benchmarks like the S&P 500 or a broader consumer‑discretionary index. If the food group consistently outpaces the broader market, it suggests sector‑specific strength.
Even a rough chart can reveal cycles: a dip during a commodity price rally, followed by a rebound when consumer demand recovers.
Step 5: Assess Valuation Gaps
With the fundamentals laid out, the next step is to see whether the market is pricing each stock fairly. Common relative‑valuation tools include:
- Price‑to‑earnings (P/E) multiple compared to the peer average.
- Enterprise‑value‑to‑EBITDA (EV/EBITDA) spread.
- Discounted cash‑flow (DCF) models that incorporate sector‑wide growth assumptions.
If a company’s P/E sits well below the group median yet its fundamentals are solid, that could signal an undervalued opportunity—provided there aren’t hidden risks.
Putting It All Together: A Practical Example
Imagine you’re analyzing three snack manufacturers: CrunchCo, SnackWave, and BiteRight. Their recent metrics look like this:
- CrunchCo: Revenue +6%, EBITDA margin 14%, ROIC 9%.
- SnackWave: Revenue +3%, EBITDA margin 12%, ROIC 7%.
- BiteRight: Revenue -2%, EBITDA margin 10%, ROIC 4%.
Supply‑chain news indicates a wheat shortage—an input both CrunchCo and SnackWave rely on heavily—while BiteRight has diversified into corn‑based snacks, less affected by wheat volatility. Meanwhile, a consumer trend report shows rising demand for low‑sugar options, a segment where CrunchCo is launching a new line.
Putting the numbers and context together, you might conclude:
- CrunchCo is a strong performer but faces near‑term input cost pressure.
- SnackWave appears stable but lacks a clear growth catalyst.
- BiteRight’s recent revenue dip could be temporary, given its ingredient diversification.
From a valuation standpoint, BiteRight trades at a P/E of 9 versus the peer average of 13, hinting at a possible buying opportunity if the wheat issue eases.
Tips for Ongoing Monitoring
- Set alerts for commodity price changes that impact your peer set.
- Quarterly, update your spreadsheet—don’t rely on a single snapshot.
- Incorporate earnings call highlights; management commentary often reveals strategic pivots.
- Periodically revisit your peer definitions; mergers and acquisitions can reshape the landscape.
Remember, group performance analysis isn’t a one‑time exercise. The food sector is dynamic, with shifting consumer tastes, regulatory tweaks, and supply‑chain shocks. By staying systematic and blending hard data with market narrative, you’ll be better positioned to spot both risks and opportunities across the food‑stock universe.
:max_bytes(150000):strip_icc()/fastfood821-e3e46aaba09b42e388fd4825f8b5c3a1.png)