How to Master the MetaTrader 4 & 5 Strategy Tester
Whether you’re a rookie trader or a seasoned pro, the Strategy Tester built into MetaTrader 4 and 5 can be the difference between guesswork and data‑driven confidence. Below you’ll find a practical walk‑through that takes you from the basics of setting up a test to fine‑tuning advanced parameters, all while keeping the learning curve manageable.
Why Use the Strategy Tester?
In a market that moves 24 hours a day, you can’t afford to trial‑and‑error on a live account. The tester lets you:
- Run an Expert Advisor (EA) against historic price data.
- Identify strengths and weaknesses before risking real capital.
- Compare multiple strategies side by side without manual tracking.
In short, it offers a sandbox where you can experiment safely and efficiently.
Getting Started: Opening the Tester
First, launch MetaTrader and look for the View → Strategy Tester menu, or simply press Ctrl+R. The window that pops up may look a bit intimidating, but its core elements are straightforward:
- Expert: the EA or script you want to evaluate.
- Symbol: the currency pair or instrument.
- Period: the timeframe (M1, H1, D1, etc.).
- Model: the algorithm for price simulation (Every tick, Control points, or Open prices).
Pick a well‑known pair like EUR/USD, select a timeframe that matches your trading style, and you’re ready to move on.
Choosing the Right Testing Model
MetaTrader offers three simulation models, each with trade‑offs:
Every Tick
Provides the most accurate representation of price movement because it processes every single tick recorded in the historical file. The downside? It can be slow, especially on longer periods.
Control Points
This method interpolates between known price points, offering a decent balance between speed and precision. Good for medium‑term strategies where you don’t need millisecond‑level detail.
Open Prices
The fastest option, but also the roughest. It only uses the daily open price, which can mask intraday volatility. Use it for quick sanity checks, not final validation.
Configuring Test Parameters
Once you’ve settled on a model, dive into the settings:
- From / To: define the historical window. Aim for at least one full market cycle (e.g., 12‑18 months) to capture different volatility regimes.
- Initial Deposit: set a realistic capital base. If you trade a $10,000 account, test with that amount rather than an arbitrary figure.
- Spread: choose between fixed or variable spreads. Variable spreads mimic real‑world conditions more closely.
- Optimization: toggle this if you want the tester to run multiple parameter combinations automatically.
Remember, the more realistic your input values, the more trustworthy the output will be.
Running a Simple Test
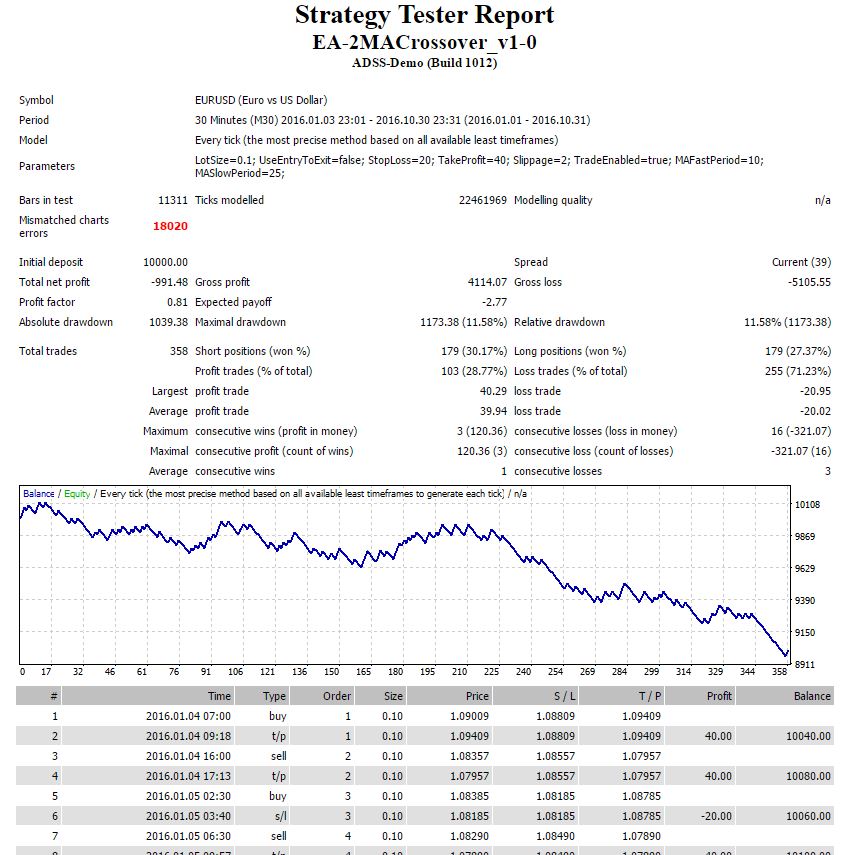
Hit the Start button and watch the progress bar crawl. While you wait, you can glance at the chart that updates in real time, showing each trade’s entry and exit. Once the run finishes, the Results tab displays crucial metrics:
- Net profit and loss.
- Maximum drawdown.
- Profit factor (gross profit ÷ gross loss).
- Expected payoff per trade.
If the numbers look promising, you might consider a deeper dive; if not, it’s time to rethink the EA’s logic.
Optimizing Parameters: A Balanced Approach
Optimization is tempting, but it can quickly become a “curve‑fitting” nightmare. Here’s a sensible workflow:
- Identify 2‑3 key variables (e.g., stop‑loss distance, take‑profit multiplier, moving‑average period).
- Set a reasonable range for each—don’t let the tester wander through absurd extremes.
- Use the Genetic Algorithm option for faster convergence, but verify the top results manually.
- Cross‑validate by running the “best” settings on an out‑of‑sample data set (a period not used in the optimization).
This way you avoid the illusion of perfection that often accompanies overly aggressive optimization.
Analyzing the Visual Report
The Graph and Report tabs provide a visual narrative of the strategy’s behavior. Look for patterns such as:
- Clustering of losses during high‑volatility sessions.
- Consistent profit spikes after a specific news release time.
- Recurring drawdowns that align with particular market conditions.
These clues can guide you to tweak entry rules, adjust risk management, or even limit trading to certain hours.
Common Pitfalls to Watch Out For
Even seasoned traders stumble into traps when using the tester:
- Over‑reliance on a single instrument. Success on EUR/USD doesn’t guarantee similar performance on GBP/JPY.
- Ignoring slippage. The default settings assume perfect order execution, which rarely happens in fast markets.
- Skipping forward testing. After a solid back‑test, run the EA on a demo account for a few weeks before going live.
Being aware of these issues saves you from costly surprises later.
Tips for Faster Testing
If you find yourself waiting hours for a result, consider these shortcuts:
- Switch to the Control Points model for a reasonable speed‑accuracy trade‑off.
- Limit the test to a narrower date range that still captures key market phases.
- Close unnecessary chart windows and disable background indicators that consume CPU.
Small efficiency gains add up, especially when you’re running multiple optimizations.
From Back‑Test to Live Execution
When the numbers finally look solid, transition carefully:
- Export the EA’s parameters into a separate .set file.
- Load the .set on a demo account, monitor performance for at least a week.
- If results remain stable, migrate to a micro‑lot live account and keep position sizes modest.
- Continuously re‑run the tester every few months to ensure the strategy stays relevant.
This incremental path helps you lock in gains while keeping risk under control.
Final Thoughts
The MetaTrader 4 and 5 Strategy Tester is more than a simple back‑testing tool; it’s a laboratory where you can dissect, refine, and validate trading ideas before committing real money. By selecting the appropriate model, configuring realistic parameters, and avoiding the lure of over‑optimization, you set the stage for a disciplined, data‑driven approach to the markets. Happy testing!