How to Understand Precision, Recall, and F1 Score Metrics
When you hear terms like precision, recall, or F1 score, it’s easy to feel like you’ve stumbled into a secret code. The good news? These metrics are basically just tools that help us see how well a model is doing, especially when we’re dealing with classification problems.
Why These Numbers Matter
Imagine you’re building a spam filter. You want it to catch as many spam emails as possible (that’s recall) but you also don’t want it to flag legitimate messages as junk (that’s precision). The balance between the two often tells you whether a model is truly useful or just over‑enthusiastic.
Precision: Getting the Right Hits
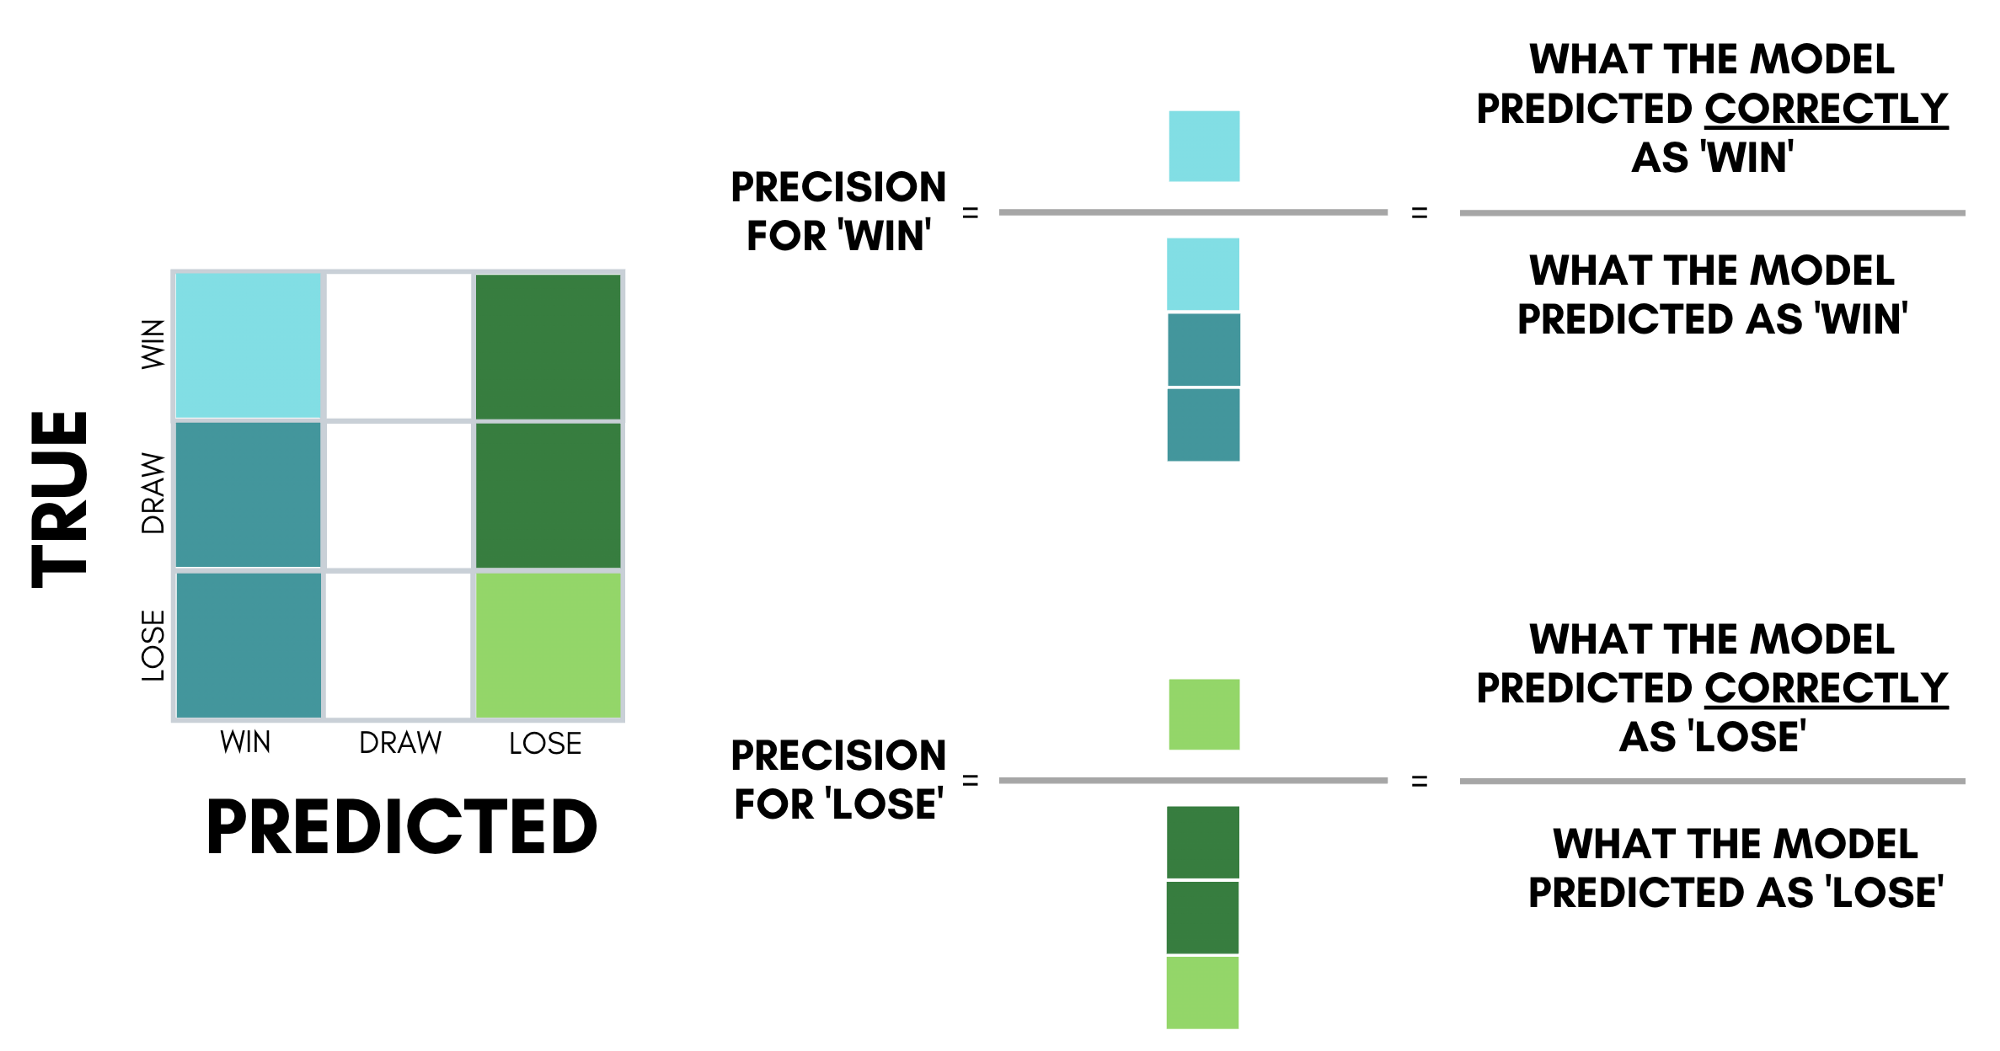
Precision is the proportion of predicted positives that are actually correct. In plain English, it answers the question: “When I say something is positive, how often am I right?”
- Formula: Precision = True Positives ÷ (True Positives + False Positives)
- High precision means fewer false alarms.
- Great for scenarios where false positives are costly—think medical diagnoses or fraud detection.
But remember, a model that never predicts positive will score a perfect precision of 1.0, even though it’s useless. That’s where recall steps in.
Recall: Capturing All the Relevant Cases
Recall, also called sensitivity, tells us how many of the actual positives we managed to catch. It asks: “Out of everything that truly is positive, how many did I find?”
- Formula: Recall = True Positives ÷ (True Positives + False Negatives)
- High recall means fewer missed positives.
- Important when missing a positive is disastrous—like detecting cancer or security breaches.
Like precision, recall can be misleading on its own. A model that labels everything as positive will achieve a recall of 1.0, but its precision will plummet.
F1 Score: The Sweet Spot Between Precision and Recall
The F1 score is the harmonic mean of precision and recall. It punishes extreme imbalances, offering a single number that reflects both concerns.
- Formula: F1 = 2 × (Precision × Recall) ÷ (Precision + Recall)
- Ranges from 0 (worst) to 1 (best).
- Best used when you need a balanced view and when false positives and false negatives carry similar weight.
Because it’s a harmonic mean, the F1 score will never exceed the lower of precision or recall. If one of them is low, the F1 score will be dragged down, which is exactly what you want to notice.
When to Prioritize Which Metric
There’s no universal rule; it depends on the problem’s context.
- Precision‑focused: Email spam filters, legal document classification.
- Recall‑focused: Disease screening, intrusion detection.
- Balanced (F1): General‑purpose text classification, recommendation engines.
Quick Example: A Small Confusion Matrix
Suppose a model evaluated on 100 cases yields:
- True Positives (TP): 40
- False Positives (FP): 10
- False Negatives (FN): 20
- True Negatives (TN): 30
Plugging the numbers in:
- Precision = 40 ÷ (40 + 10) = 0.80
- Recall = 40 ÷ (40 + 20) = 0.67
- F1 = 2 × (0.80 × 0.67) ÷ (0.80 + 0.67) ≈ 0.73
So the model is pretty good at not raising false alarms, but it still misses about a third of the real positives.
Common Pitfalls to Avoid
Even seasoned data scientists slip into these traps:
- Relying solely on accuracy in imbalanced datasets—accuracy can be misleading when one class dominates.
- Choosing the wrong metric for the business goal, e.g., optimizing for precision when missing a positive is catastrophic.
- Ignoring the effect of threshold selection; shifting the decision boundary can dramatically swing precision and recall.
Adjusting the Decision Threshold
Most classifiers output a probability score. By default, anything above 0.5 is labeled positive. Lower that threshold, and you’ll catch more positives (higher recall) at the expense of precision. Raise it, and you tighten precision but may lose recall. Experimenting with different thresholds and plotting precision‑recall curves can reveal the sweet spot for your needs.
Visual Tools: Precision‑Recall Curves
A precision‑recall curve shows how precision and recall trade off as you sweep the threshold. The area under this curve (AUC‑PR) offers a summary metric similar to ROC‑AUC but more informative when dealing with skewed classes.
Putting It All Together
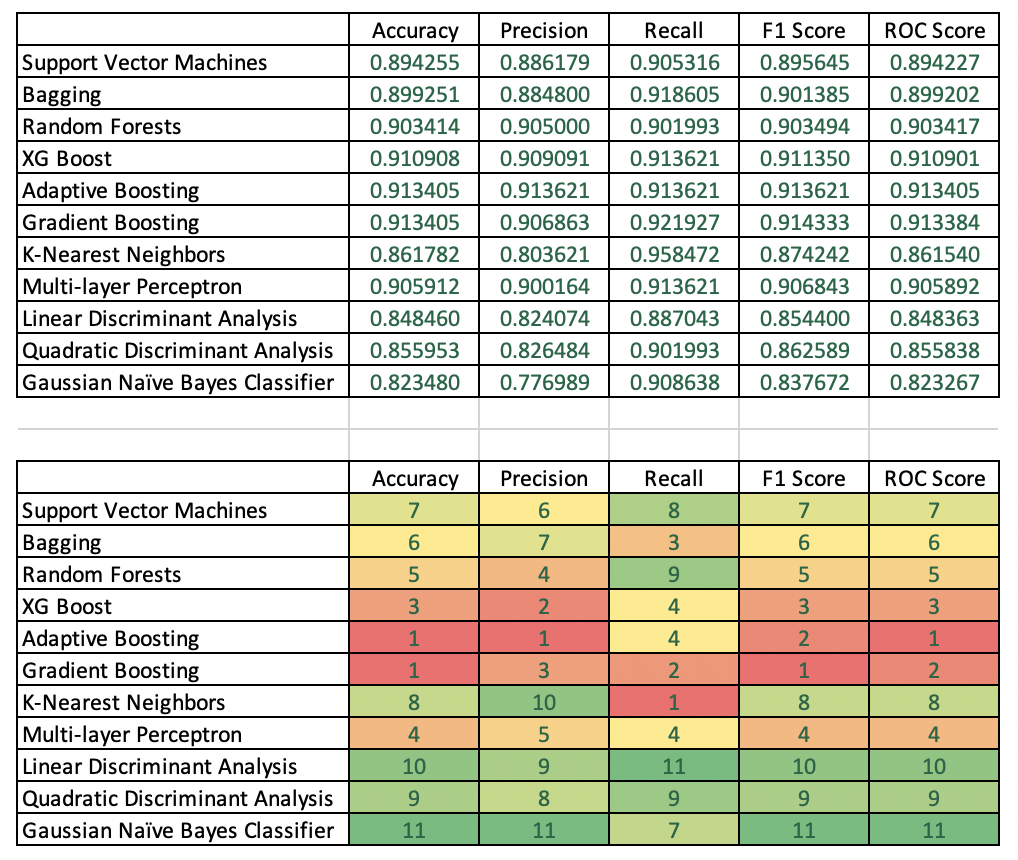
In practice, you’ll often report all three numbers. They tell a more complete story than any single metric could. When presenting results to stakeholders, explain what each figure means for the real‑world impact—whether that’s fewer false alarms, catching more cases, or striking a balanced compromise.
Takeaway Checklist
- Identify which error is costlier for your problem.
- Calculate precision, recall, and F1 on a validation set.
- Inspect the confusion matrix for hidden patterns.
- Experiment with thresholds and plot the precision‑recall curve.
- Report the metrics together, not in isolation.