How to Use Crime Maps in Indianapolis to Stay Informed
Whether you’re scouting a new neighborhood, checking on a recent break‑in, or just curious about safety trends, crime maps can be a surprisingly practical tool. In Indianapolis they’re not just static charts; they’re interactive dashboards that let you drill down to the block level, compare different offense types, and even spot patterns over time. Below we’ll walk through the basics, highlight the most reliable sources, and share a few tips for turning raw data into useful insight.
What Makes an Indianapolis Crime Map Useful?
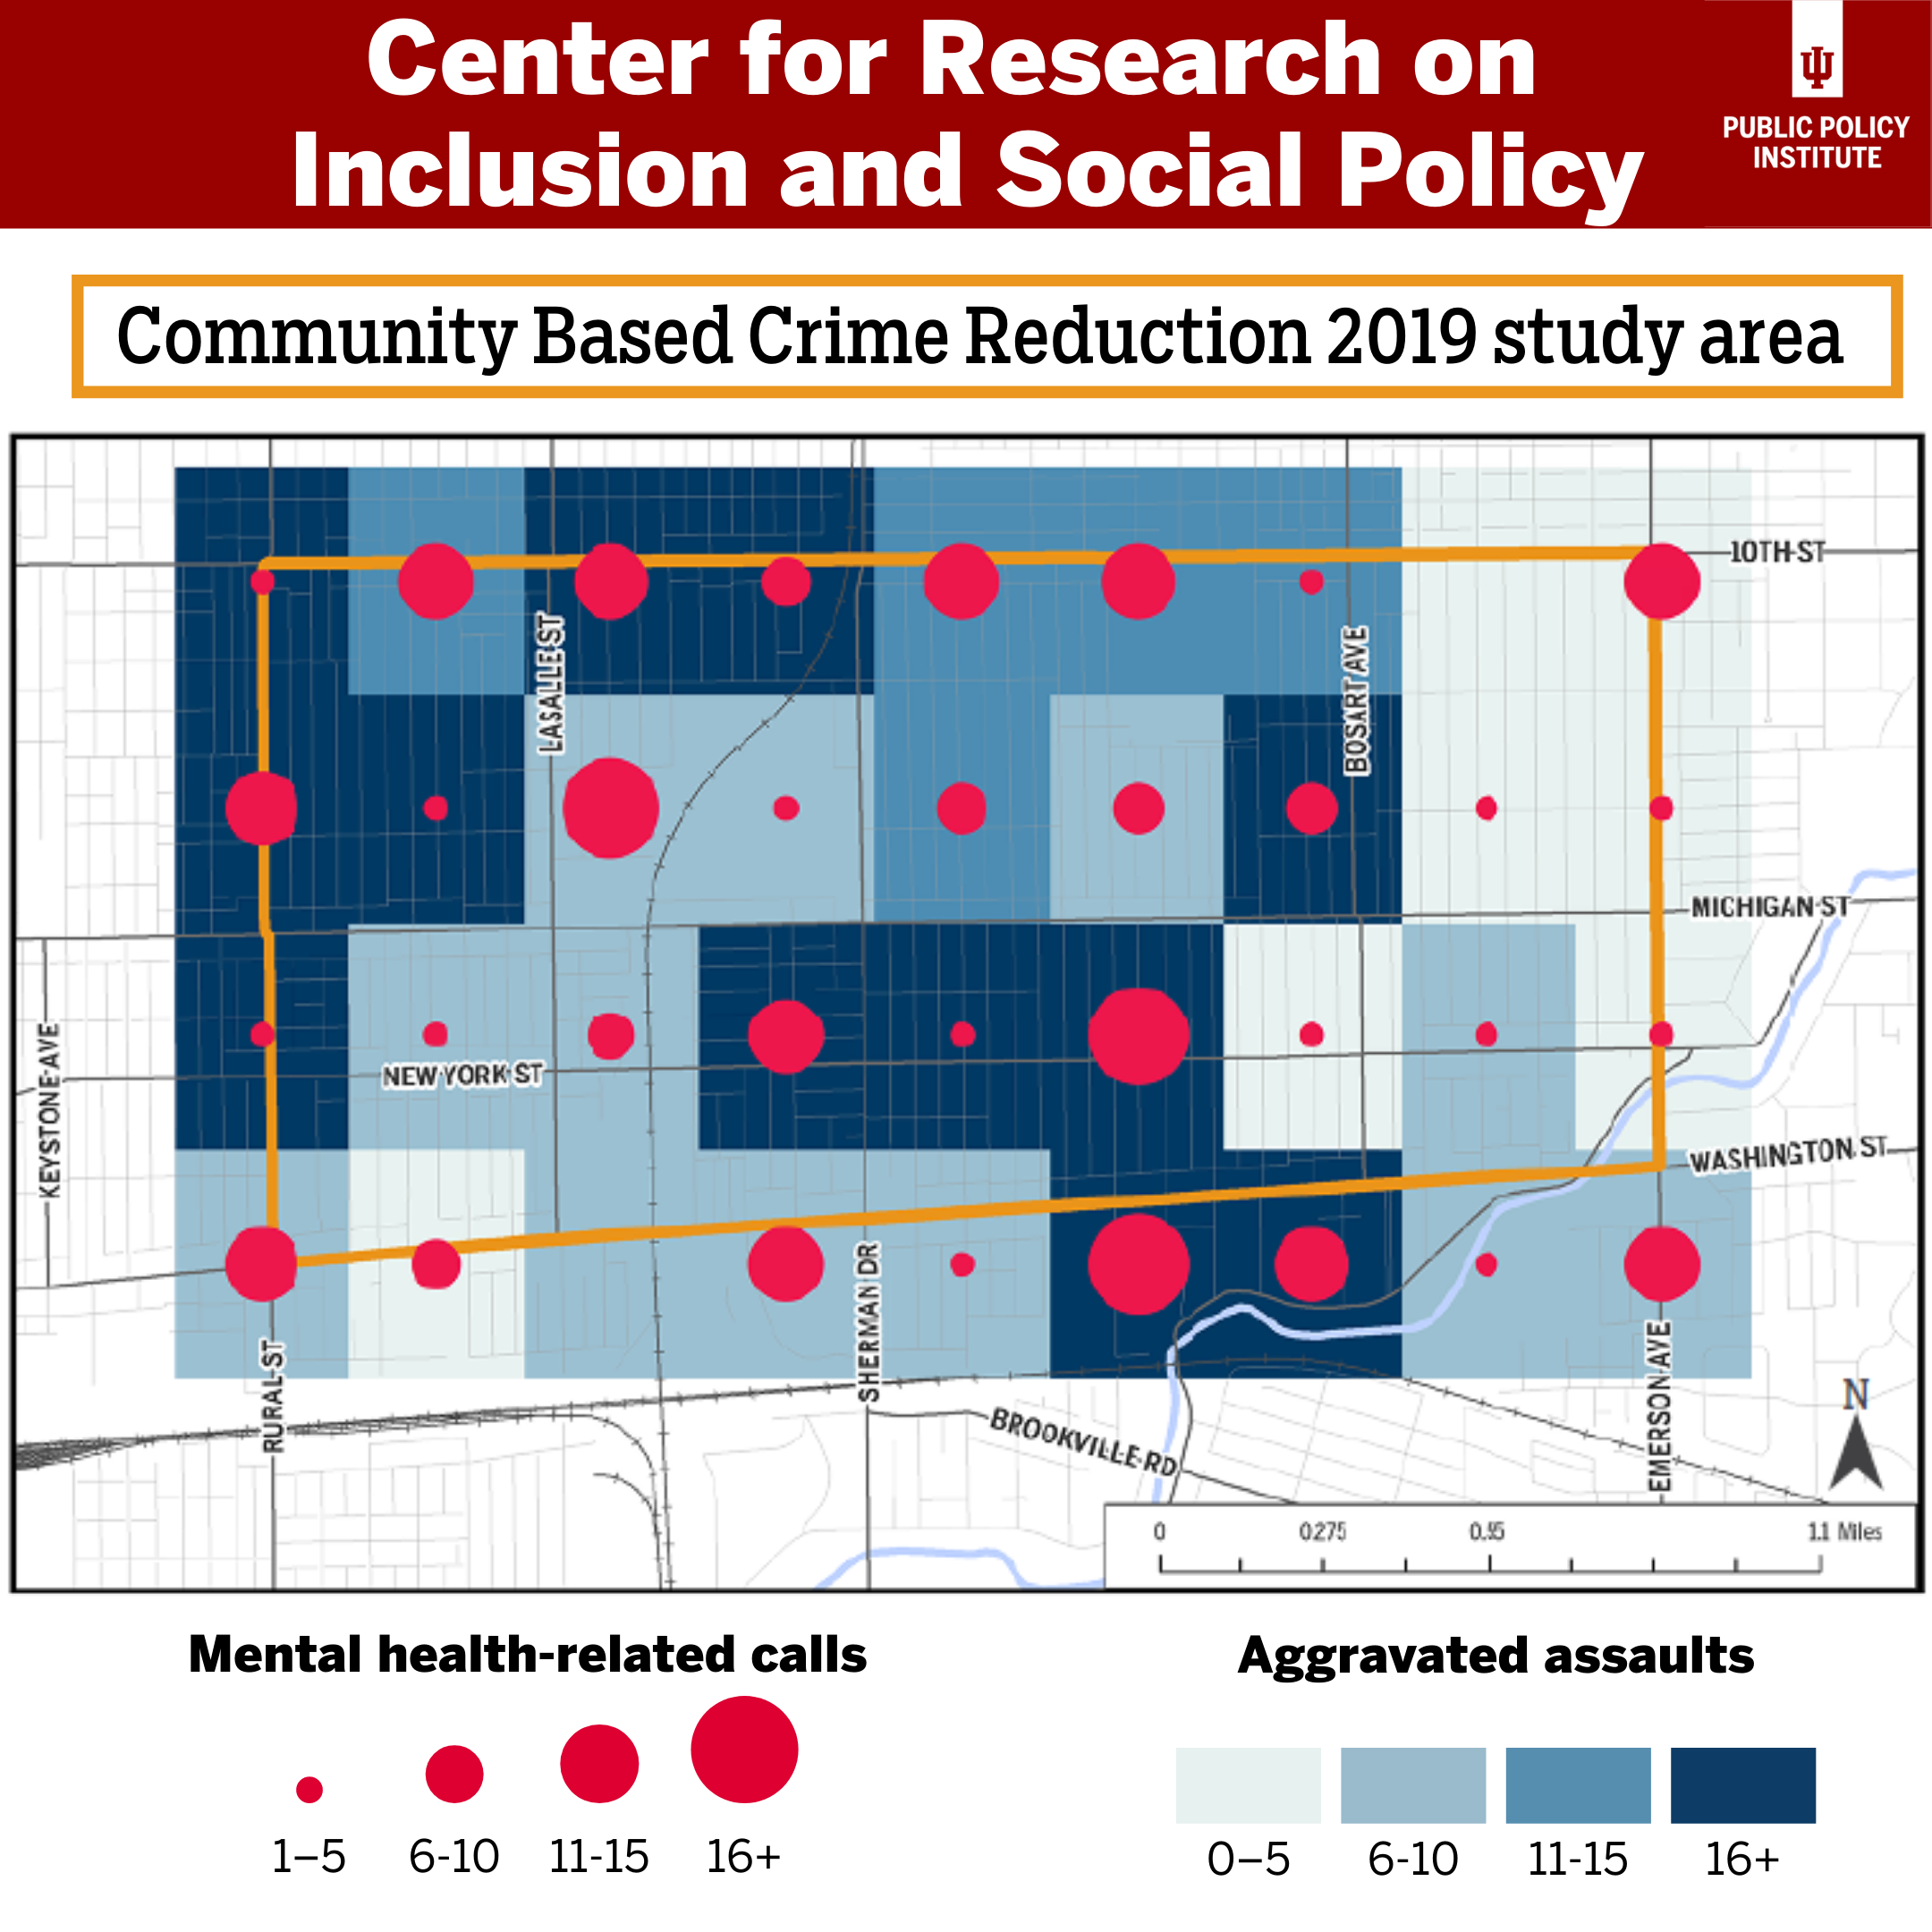
At first glance a crime map looks like a colorful overlay of pins or shades on a city layout. The real power lies in three things:
- Granularity. Modern maps let you zoom from the whole city right down to a single street, so you can see exactly where incidents cluster.
- Time filters. You can select a range—last month, past six months, or a custom window—to spot short‑term spikes or longer‑term trends.
- Category breakdown. From property crimes like burglary to violent offenses such as assault, you can toggle layers to focus on what matters most to you.
Where to Find Reliable Crime Data for Indianapolis
Not all maps are created equal. Here are the top sources you can trust:
1. Indianapolis Metropolitan Police Department (IMPD) Interactive Map
The department’s official portal offers a live feed of reported incidents. Data is refreshed daily, and each point includes a brief description, date, and crime type. Because it comes straight from law‑enforcement records, you’re getting the most up‑to‑date picture possible.
2. Indianapolis Open Data Portal
This city‑run site hosts downloadable CSV files covering several years of crime reports. If you’re comfortable with a spreadsheet, you can create custom visualizations or merge the data with other demographic layers.
3. Third‑Party Platforms (e.g., SpotCrime, CrimeMapping.com)
These aggregators pull from official feeds and add features like heat‑maps or alerts. They’re handy for quick checks, but remember they may lag a day or two behind the IMPD source.
How to Read the Map without Getting Overwhelmed
Even a seasoned resident can feel daunted by a wall of colored dots. Try these quick tricks:
- Start broad. Look at the citywide heat‑map to identify high‑risk zones.
- Zoom in. Once you’ve spotted a hotspot, zoom to the street level to see if incidents are clustered or spread out.
- Filter by crime type. If you’re concerned about property theft, turn off violent crime layers—this narrows the visual noise.
- Check the timeline. A sudden flash of incidents over a few days might indicate a temporary issue (like a construction site) rather than a persistent problem.
Practical Uses for Everyday Life
Crime maps aren’t just for the hyper‑cautious; they can support everyday decisions.
Choosing a Rental or Home
Before signing a lease, pull up the map for the neighborhood and compare the frequency of burglaries and assaults to city averages. If a block shows a spike in recent break‑ins, you might prioritize a property with better lighting or a security system.
Planning Evening Activities
Looking for a safe spot to meet friends after dark? Filter the map for the past month’s incidents after 8 p.m. and you’ll quickly see which streets tend to stay quiet and which see a flurry of reports.
Community Advocacy
Neighborhood associations can use the data to request additional streetlights, cameras, or patrols. A visual heat‑map presented at a city council meeting often speaks louder than raw numbers alone.
Tips for Interpreting the Data Responsibly
Crime data, by nature, reflects reported incidents—not necessarily every crime that occurs. Keep these nuances in mind:
- Reporting bias. Some neighborhoods may report more frequently due to stronger community outreach, which can make the area appear less safe than it actually is.
- Population density. A high number of incidents in a densely populated district may translate to a lower per‑capita rate than a sparsely populated suburb with fewer total crimes.
- Temporal anomalies. Large events—concerts, sports games, festivals—can temporarily inflate crime numbers. Look for patterns that persist beyond these spikes.
Setting Up Alerts for Real‑Time Updates
If you want to stay ahead of the curve, many platforms let you sign up for email or push notifications. Choose the crime categories that matter most, set a radius around your home or workplace, and you’ll get a brief summary whenever a new report lands inside that zone. It’s a low‑effort way to keep your eyes on the neighborhood without constantly refreshing a map.
Combining Crime Maps with Other Neighborhood Data
For a fuller picture, pair crime insights with complementary data sets:
- School ratings. Good schools often correlate with lower property crime rates.
- Walkability scores. Areas with higher foot traffic tend to deter certain offenses.
- Housing trends. Rapid price increases can sometimes precede shifts in crime patterns.
When you overlay these layers in a GIS tool or even a simple spreadsheet, you start seeing the broader story—not just a snapshot of incidents.
When to Trust the Map—and When to Call It In
Interactive maps are great for spotting trends, but they’re not a substitute for on‑the‑ground intuition. If a map shows a clean street but you notice broken windows, poor lighting, or a lot of loitering, trust your senses. Likewise, a hot spot on the map doesn’t automatically mean you’ll be a victim; many crimes are opportunistic and can be prevented with simple precautions.
In short, crime maps for Indianapolis are a versatile resource when used thoughtfully. By selecting the right source, filtering wisely, and pairing the visual data with local knowledge, you can make smarter, safer choices—whether you’re moving, commuting, or just keeping an eye on your community.