How to Use the Google Hurricane Tracker
When a hurricane is churning in the Atlantic, information is everything. The old days of scanning weather radios and frantically flipping through local news channels are largely behind us. Today, most people reach for their phones, opening Google Maps to see exactly what is happening. This is where the Google Hurricane Tracker comes into play. It’s not just a map; it’s a dynamic visualization tool that helps you understand a storm’s path, intensity, and potential impact in real-time.
Staying ahead of storms isn’t just about knowing if you need to evacuate. It’s about understanding the window of time you have to prepare. Whether you are a coastal resident worried about flooding or an inland dweller bracing for heavy rain, the interface provides a level of detail that can be the difference between being prepared and being caught off guard. Let’s break down how to use it effectively and what those color-coded lines actually mean.
Activating the Storm Layer on Google Maps
The tracker isn’t always visible by default. You have to actively turn it on, much like toggling traffic or terrain views. Open the Google Maps app on your mobile device or go to maps.google.com on your desktop. Once the map loads, look for the "Layers" button. It usually looks like a small stack of squares in the top right corner on mobile or the bottom left on a desktop browser.
Click or tap that button. A menu will appear with various options like Traffic, Transit, Terrain, and indeed, Weather. Select Weather. Immediately, the map transforms. Blue and green patches indicate rain, while darker shades show intensity. But for hurricanes, you need to go one step further. If a named storm is active, you will often see a specific "Hurricane" or "Storm Track" option within that weather layer menu. If you don’t see it immediately, search for "Hurricane [Name]" directly in the search bar. Google is smart enough to overlay the storm track onto your current map view automatically.
Decoding the Visuals and Forecast Cones
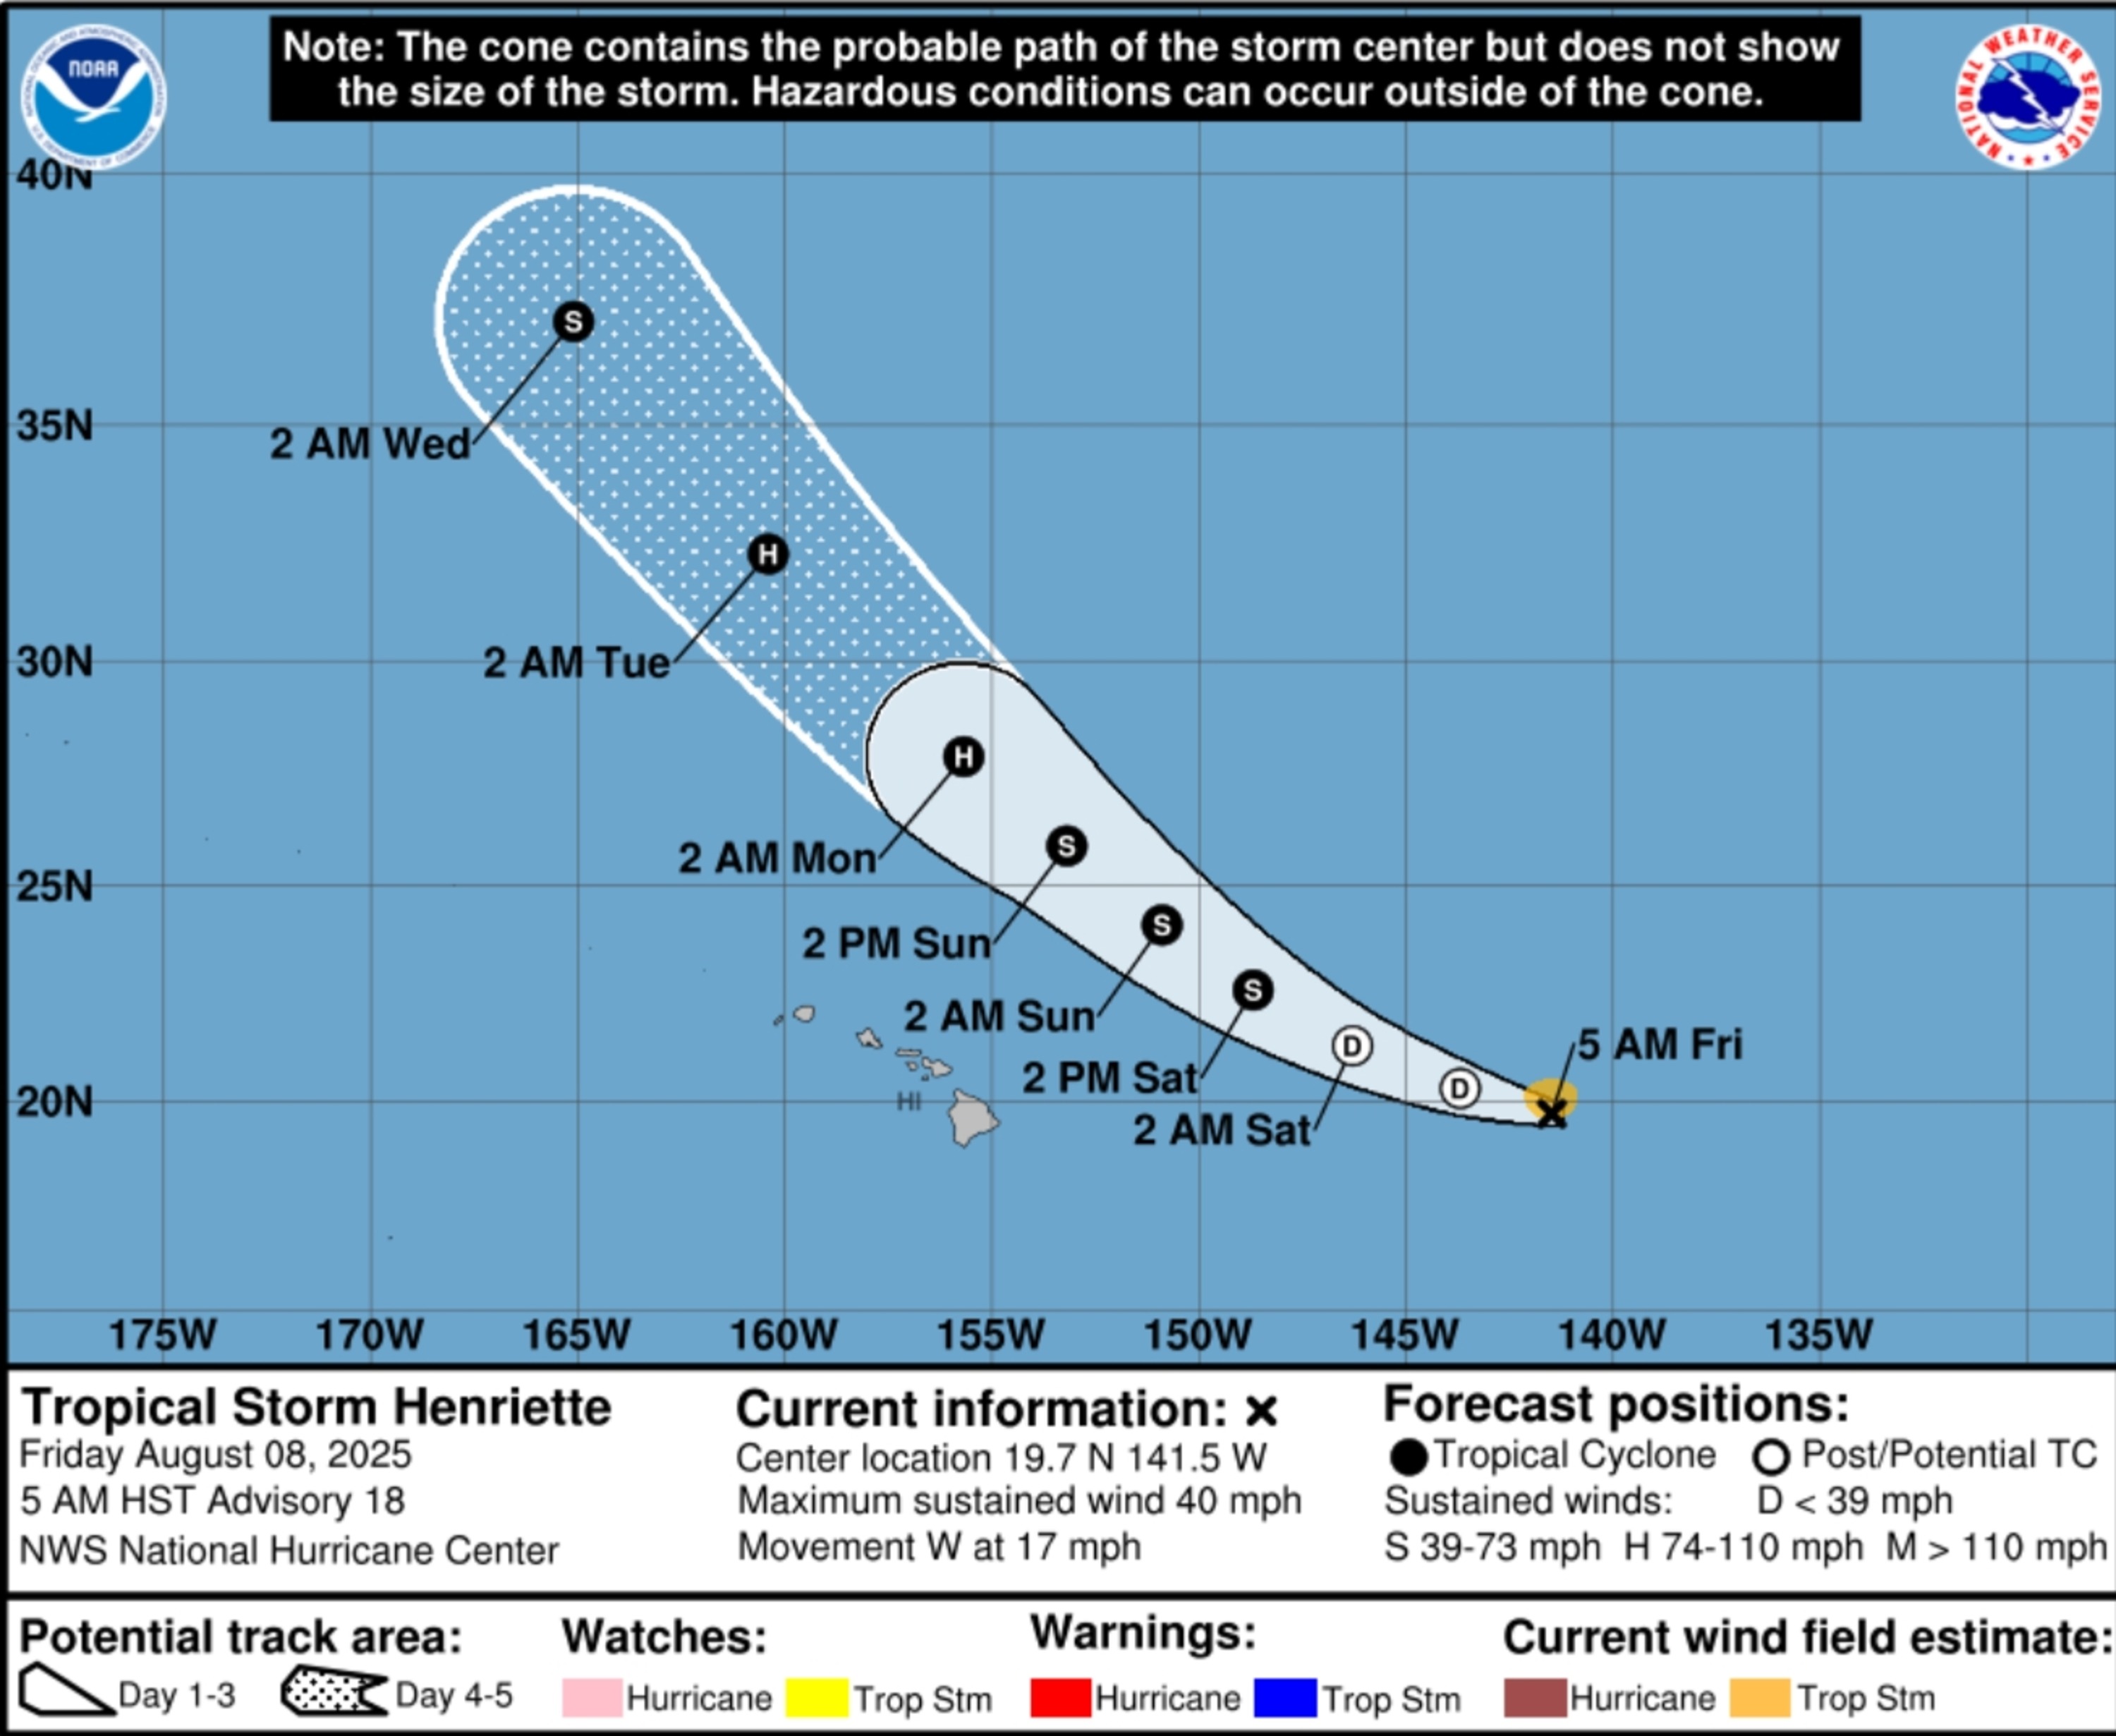
Once the overlay is active, you are looking at a complex visualization. The most prominent feature is the projected path of the storm. This is usually depicted as a line with circles along it. Each circle represents the predicted center of the storm at specific times—often every six or twelve hours. Pay close attention to the size of these circles. They aren’t random; they represent the radius of the strongest winds, typically where winds are at least 39 mph (tropical storm force) or 74 mph (hurricane force).
You might also see a cone-shaped shading around the path. This is the "cone of uncertainty." It is crucial to understand what this does and does not mean. The cone indicates where the center of the storm is most likely to travel based on historical model performance. It does not define the area that will be affected by wind or rain. In fact, dangerous weather can occur well outside the cone. Always check the specific wind radius circles for a more accurate idea of potential impact zones.
Real-Time Radar and Future Cast
Static maps are useful for long-range planning, but storms change. Google’s "Future Radar" feature is arguably the most powerful tool in this arsenal. This feature allows you to scroll through a timeline of weather. You can drag a slider to see what the radar looks like right now, or move it forward to see predicted precipitation for the next several hours.
This is incredibly handy for micro-planning. Instead of just knowing a hurricane is ten days away, you can see exactly when the outer bands are likely to hit your neighborhood. This helps you decide when to bring in patio furniture, secure loose items, or head to the grocery store before the first heavy downpour starts. The accuracy isn’t perfect for beyond 24 hours, but for the immediate pre-storm window, it is surprisingly reliable.
Safety Alerts and Local Context
The map doesn’t operate in a vacuum. It integrates with other Google services to provide context. If an official evacuation order or severe weather warning is issued for your location, you may see alerts pop up directly on the map interface. Look for colored rectangles on the map boundary—red for severe, orange for warnings, and yellow for watches.
These alerts are pulled from local National Weather Service stations and emergency management agencies. They provide the ground-truth data that satellite imagery alone cannot. It is vital to cross-reference the visual tracker with these text-based alerts. A storm might look like it’s missing you on the radar, but local flash flood warnings might indicate otherwise due to topography and local drainage issues.
Practical Tips for Storm Tracking
- Check Multiple Times: Storm models change daily. The path predicted today might shift by the weekend. Make checking the tracker a daily habit once a system is named.
- Use Street View: In the aftermath, or during lulls, you can use Street View to check for downed trees or blocked roads if available in your area, though this is limited in real-time emergency situations.
- Power Considerations: Use the desktop version when possible to save battery on your phone. If you lose power, a fully charged phone with offline maps downloaded is your best backup, though live tracking requires data.
What to Do When You See the Red Lights
Seeing a storm track heading toward your zip code can induce panic. The track is designed to inform, not alarm. Use the information to trigger your pre-made plan. Do not wait until the storm is making landfall to boil water or charge devices. The tracker gives you a lead time. Use that lead time to secure your home, fill up your gas tank, and ensure you have enough supplies. The map tells you where the storm is going; your preparation determines how you survive it.
Frequently Asked Questions
Is the Google Hurricane Tracker free to use?
Yes, the hurricane tracking and weather layers on Google Maps are completely free for all users across mobile and desktop platforms.
How accurate is the storm path prediction?
Google aggregates data from multiple high-resolution computer models. While no forecast is 100% accurate, the convergence of major models usually provides a reliable general path, though exact landfall points can shift as the storm approaches.
Can I track storms on an Android or iPhone?
The feature is fully integrated into the native Google Maps apps for both iOS and Android devices, offering the same functionality as the desktop site.
Does the tracker show only hurricanes?
No, the Weather layer displays all active weather systems, including tropical depressions, named storms, and mid-latitude winter storms, depending on your location and the season.