IAI: Your Guide To Building Financial Models
Ever opened a spreadsheet and felt the weight of decisions staring back at you? A well‑crafted financial model can turn that pressure into clarity, letting you test assumptions, forecast outcomes, and speak the language investors love. Below is a down‑to‑earth walk‑through, peppered with practical tips you can apply right now.
Why Financial Models Matter
Numbers tell a story, but only if they’re organized, logical, and transparent. A solid model:
- Provides a single source of truth for stakeholders.
- Highlights the financial impact of strategic choices before they’re made.
- Enables scenario analysis without rewriting the entire workbook.
In short, it’s the bridge between raw data and informed decisions.
Key Components of a Robust Model
Think of a financial model as a house. You need a firm foundation, sturdy walls, and a roof that protects the whole structure.
Assumptions Sheet
All inputs—growth rates, discount factors, cost percentages—live here. Keep it separate, label each cell, and use data validation when possible. A tidy assumptions page reduces the chance of hidden errors.
Operating Statements
Revenue, cost of goods sold, operating expenses, and net income are the core line items. Link every figure back to your assumptions. If you change a growth rate, the ripple should be visible instantly.
Balance Sheet & Cash Flow
These sections tie the model together. Use the “link‑through” method: the cash balance at the end of one period becomes the opening cash for the next. That simple loop often catches mismatches early.
Supporting Schedules
Depreciation, working‑capital, and debt amortization each deserve their own mini‑tables. They feed the main statements and make the model easier to audit.
Step‑by‑Step Build Process
Don’t try to build everything at once. Start small, validate, then expand.
- Define the purpose. Is the model for a startup pitch, a M&A valuation, or internal budgeting? The goal determines the level of detail required.
- Gather historical data. Pull three to five years of actuals if available; they’ll anchor your forecasts.
- Set up the assumptions tab. Enter only the variables you expect to change—keep constants hard‑coded in the calculations instead.
- Build the income statement. Begin with top‑line revenue, then sequentially add cost items, ensuring each line references a driver.
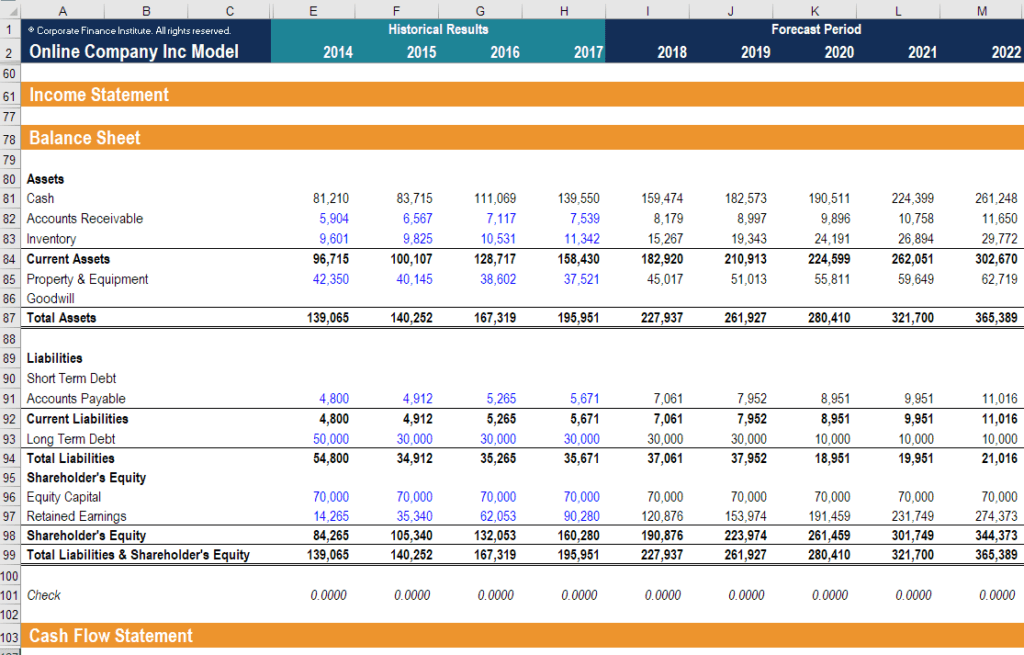
- Construct the balance sheet. Link assets to liabilities and equity, and double‑check that assets = liabilities + equity at each period.
- Wrap it with cash flow. Reconcile net income to cash by adding back non‑cash charges and subtracting changes in working capital.
- Test scenarios. Flip a growth rate, watch the output, and make sure formulas stay intact.
At each stage, pause to verify that totals balance and that numbers make sense in the real world. A quick sanity check—like comparing projected profit margins against industry benchmarks—can save hours of rework later.
Tips for Accuracy and Flexibility
- Use consistent units. Mix dollars and thousands? You’ll be surprised how often a misplaced decimal creeps in.
- Color‑code cells. Blue for inputs, black for formulas, red for alerts (such as negative cash balances).
- Employ named ranges. Instead of $B$2, name the cell “RevenueGrowth” and reference that name throughout the model.
- Document as you go. A brief comment next to a complex formula can be a lifesaver when you—or a colleague—return months later.
- Keep it modular. Break large calculations into intermediate steps; it makes debugging far less daunting.
Common Pitfalls to Avoid
Even seasoned analysts stumble over a few recurring traps:
- Hard‑coding numbers. Embedding a figure directly into a formula locks you out of later adjustments.
- Over‑complicating the model. Adding excessive detail can obscure the main insights and slow down updates.
- Neglecting circular references. While sometimes necessary (e.g., for interest calculations), they should be handled with care and clear documentation.
- Ignoring sensitivity analysis. A model that only shows a single “base case” offers little strategic value.
Spotting these issues early—by walking through each sheet with a fresh pair of eyes—keeps the model trustworthy.
Bringing It All Together
When the last cell is linked, the assumptions are tidy, and the scenarios run smoothly, you’ve built more than a spreadsheet; you’ve created a decision‑making engine. Use it to ask the hard questions: “What if sales dip 10%?” or “How does a new loan affect our cash runway?” The answers will guide conversations, support negotiations, and ultimately drive better outcomes.